Marketers need to paint a picture of their buyers, humanizing them and understanding their preferences. This is not only important for general messaging but also necessary for target marketing. Syndicated household and shopper panel data is an excellent tool for helping to understand consumer characteristics. Not familiar with this panel data? You may want to review one or two basic articles on this topic before reading on.
Why use panel data versus survey research for understanding the consumer? Because:
- Panel data allows you to quickly hone in on a particular group, based on their known buying behavior
- Because it’s syndicated, panel data is always there, ready for you to tap into it
So let’s say you want to know more about frequent buyers of your brand. You could go out and survey people regarding their brand usage and, when you hit a heavy user, ask them questions about themselves. Or you could go to Nielsen, IRI, Numerator, Fetch Rewards or any other panel vendor and run a report or have them run one for you, profiling the panelists who meet your heavy buyer definition.
In this post, I’ll show you what those types of profile reports typically look like, using the classic use case of demographics. Then I’ll talk more about what other types of consumer characteristics are available. The basic report structure will be similar no matter what characteristics you are focusing on.
The Basics: Demographics
In the report example below, the demographics included are age, presence of children and income. Other common demographics would include race/ethnicity, employment, size of household, and education level. Each vendor will have slightly different characteristics to offer but these basic demographics are likely to always be available.
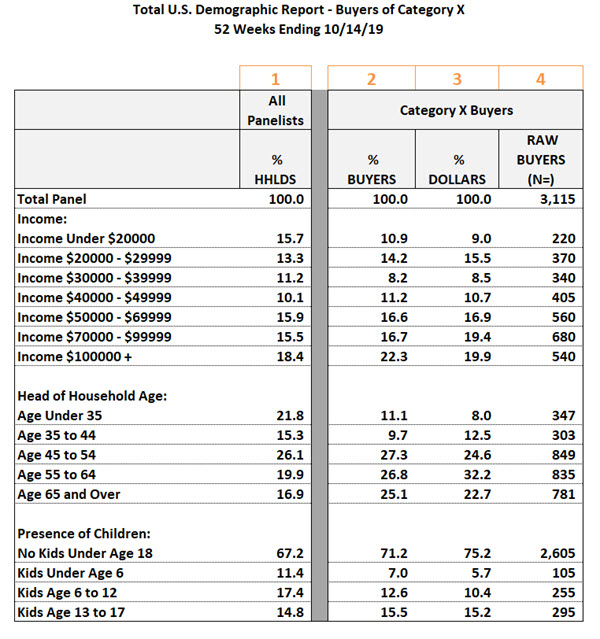
Below the table, I’ll walk you through this report. Let’s walk through this report. Please refer to the orange numbers above each column.

1. % of HHLDS = % of Households. This column shows you the % of all panelists in each group. This is everyone in the panel and doesn’t have anything (yet) to do with your buyers or whatever shopper group you are targeting for analysis. Usually, this will mirror the percentage of U.S. households. Panel data vendors will typically balance and/or adjust their panels so they match the total U.S. population. Some vendors won’t be looking at households, they’ll be looking at individuals. In that case, this column might say % of Population.
2. % of Buyers. This report example is focusing on buyers of a particular category and showing the share of buyers (but not the share of sales or volume) falling into each demographic group. This shows you the demographic distribution of your target shopper group (buyers of the category in this case but target buyer group could be heavy category buyers, brand buyers, your competitor’s buyers or any other purchase-based target group you can think up). Again, vendors will differ on whether their data represents the entire household’s purchases or just the purchases of a single shopper, and that distinction may be important in interpreting the data, but the structure of the report will be pretty consistent.
3. % of Dollars. This column shows how category dollars break out into each demographic group. Some groups of consumers might tend to be heavier or lighter buyers and that will be reflected in this column. % of Buyers is all about penetration and % of Dollars will reflect both penetration and buying rate. You could also look at % of volume rather than % of dollars – same idea.
4. Raw buyers. This is important to check to make sure you have a decent sample of panelists reflected in your analysis. This is going to be driven by the penetration of your buyer group and also by the raw panel size of the vendor. If you only have 50 total buyers, you are wasting your money on the analysis! This is something vendors can and will tell you ahead of time. They don’t want you to waste your money either. Sometimes you’ll have plenty of total buyers but not too many people in a particular group. That’s ok – just don’t drill down further on that group.
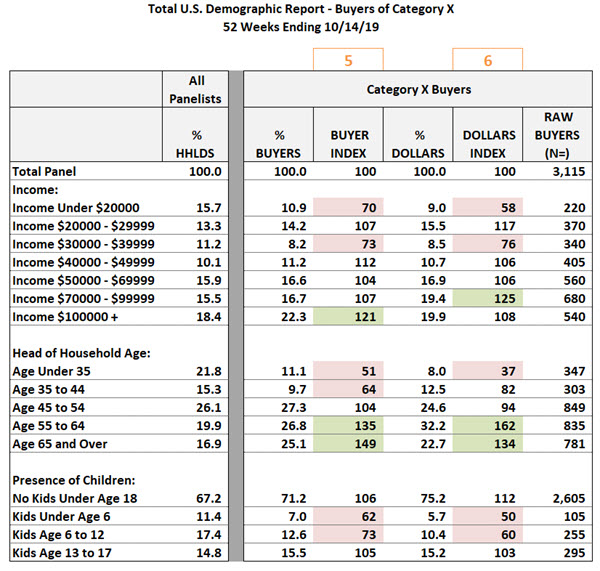
In addition to looking at absolute percentages, most marketers also want an easy way to compare their buyer group distribution to the distribution of total households. Constructing an index makes that comparison easy.

Again, referring to the orange numbers above each column in the table above:
5. Buyer Index = (% Buyers ÷ % Households)*100. Like most indices, 100 would be average and the convention is to focus on indices above 120 (higher than average) or below 80 (lower than average).
6. Dollar Index = (% Dollars ÷ % Households)*100.
I’ve highlighted indices above 120 in red and below 80 in pink.
Analyzing the data in this example, we see that category buyers tend to be higher income, older and without little kids. But it’s important to not focus only on the indices but also keep an eye on the absolute numbers. Even if your demographic skews higher income, for example, it still might be the case that over half of your buyers are lower income so you don’t want to ignore that group.
As I’ve mentioned above, some details of the report will vary from vendor to vendor but these basic elements are likely to be consistent: there will be a column for all shoppers, a column for your target group (category buyers in my example) and an index.
Beyond Demographics
Now that you understand the basic report structure, let’s lay out some of the other shopper characteristics that you might put in that left-hand column. Panel vendors can gather all kinds of information about their panelists and tag those shoppers with each of those human “attributes”. Just like products have attributes that allow you to create custom product groups, panelists have attributes that allow you to paint a picture of groups of shoppers. Here are just some of the shopper characteristics/attributes you might find in these syndicated reports (options will vary by vendors):
- Geodemographics which combine location with demographic variables (e.g. modest working towns, affluent suburban spreads)
- Nested demographics which roll several standard demographic variables together (e.g. high-income empty nesters)
- Generation (e.g. Millennials, GenX) which is another take on age
- Community affiliation such as LGBTQ+ or religion
- Pet ownership
- Cooking, dining out, and other food-related habits
- Attitudes towards the economy, technology, health care and more
- Retailer specific segments – some retailers have custom segmentations they have created for their stores and panelists can be tagged with each of those (e.g. harried health nuts, indulgent treat-seekers)
- Medical or dietary concerns
- Interest in specific sports or recreational activities or hobbies
- Media consumption and touchpoints
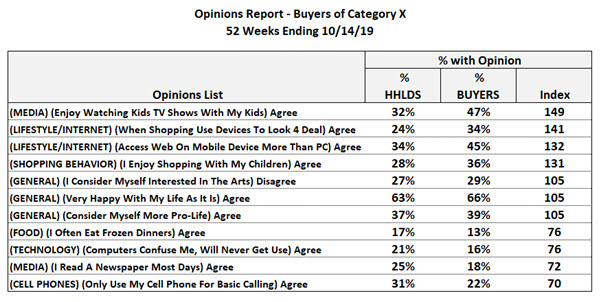
Here is an example of a syndicated profile report looking at buyer opinions on a variety of topics (this is a small extract from the giant actual report which included over 100 opinions):

And here’s a sample brand report from Numerator’s website that looks at some other variables like trip mission and cross purchasing behavior (note that they only included the indices in these public snapshots).
As you can see, on-demand profiles available from syndicated panel data can help you understand your buyers, allowing fast insights into their demographics, psychographics and many aspects of their attitudes and behavior.
Want more articles about panel data? Click the panel data tag in our world cloud on the right.

Leave a Reply