 We’re delighted to have guest contributor Sandy Skrovan, content marketing manager for Profitero, sharing her expertise in ecommerce intelligence. Please direct comments and questions directly to Sandy. Her contact details can be found at the end of this article.
A flurry of activity this past year is transforming the eCommerce data, measurement and analytics landscape. As companies jockey for position in the fast-paced eCommerce environment, some data analytics providers are expanding their functionality and solutions through strategic partnerships, or outright acquisition and consolidation.
Some of the key developments:
- [New in Q1 2021] Both Nielsen and IRI have enhanced their coverage to provide a more complete picture of the omnichannel retail landscape for CPG.
- Global information specialist Ascential merged together several eCommerce intelligence companies acquired during the past two years (including OCR, Clavis and Brand View) under a single umbrella called Edge by Ascential.
- Numerator has gotten into the mix by integrating the companies formerly known as Market Track and Infoscout, bringing together omnichannel marketing, merchandising and sales data.
Keeping track of what datasets are available
Half of the brands Profitero surveyed in 2018 say that measuring and reporting on how eCommerce is performing as a distribution channel is a top challenge. A common fear is that companies will be left behind by competitors who have superior eCommerce analytics and performance measurement capabilities, and therefore access to better insights to make smarter, faster decisions.
With a host of eCommerce data analytics solutions to choose from — and choices getting somewhat muddied by the changing landscape of providers — how do you know what datasets and solutions you need, and what will support and drive your business decisions?
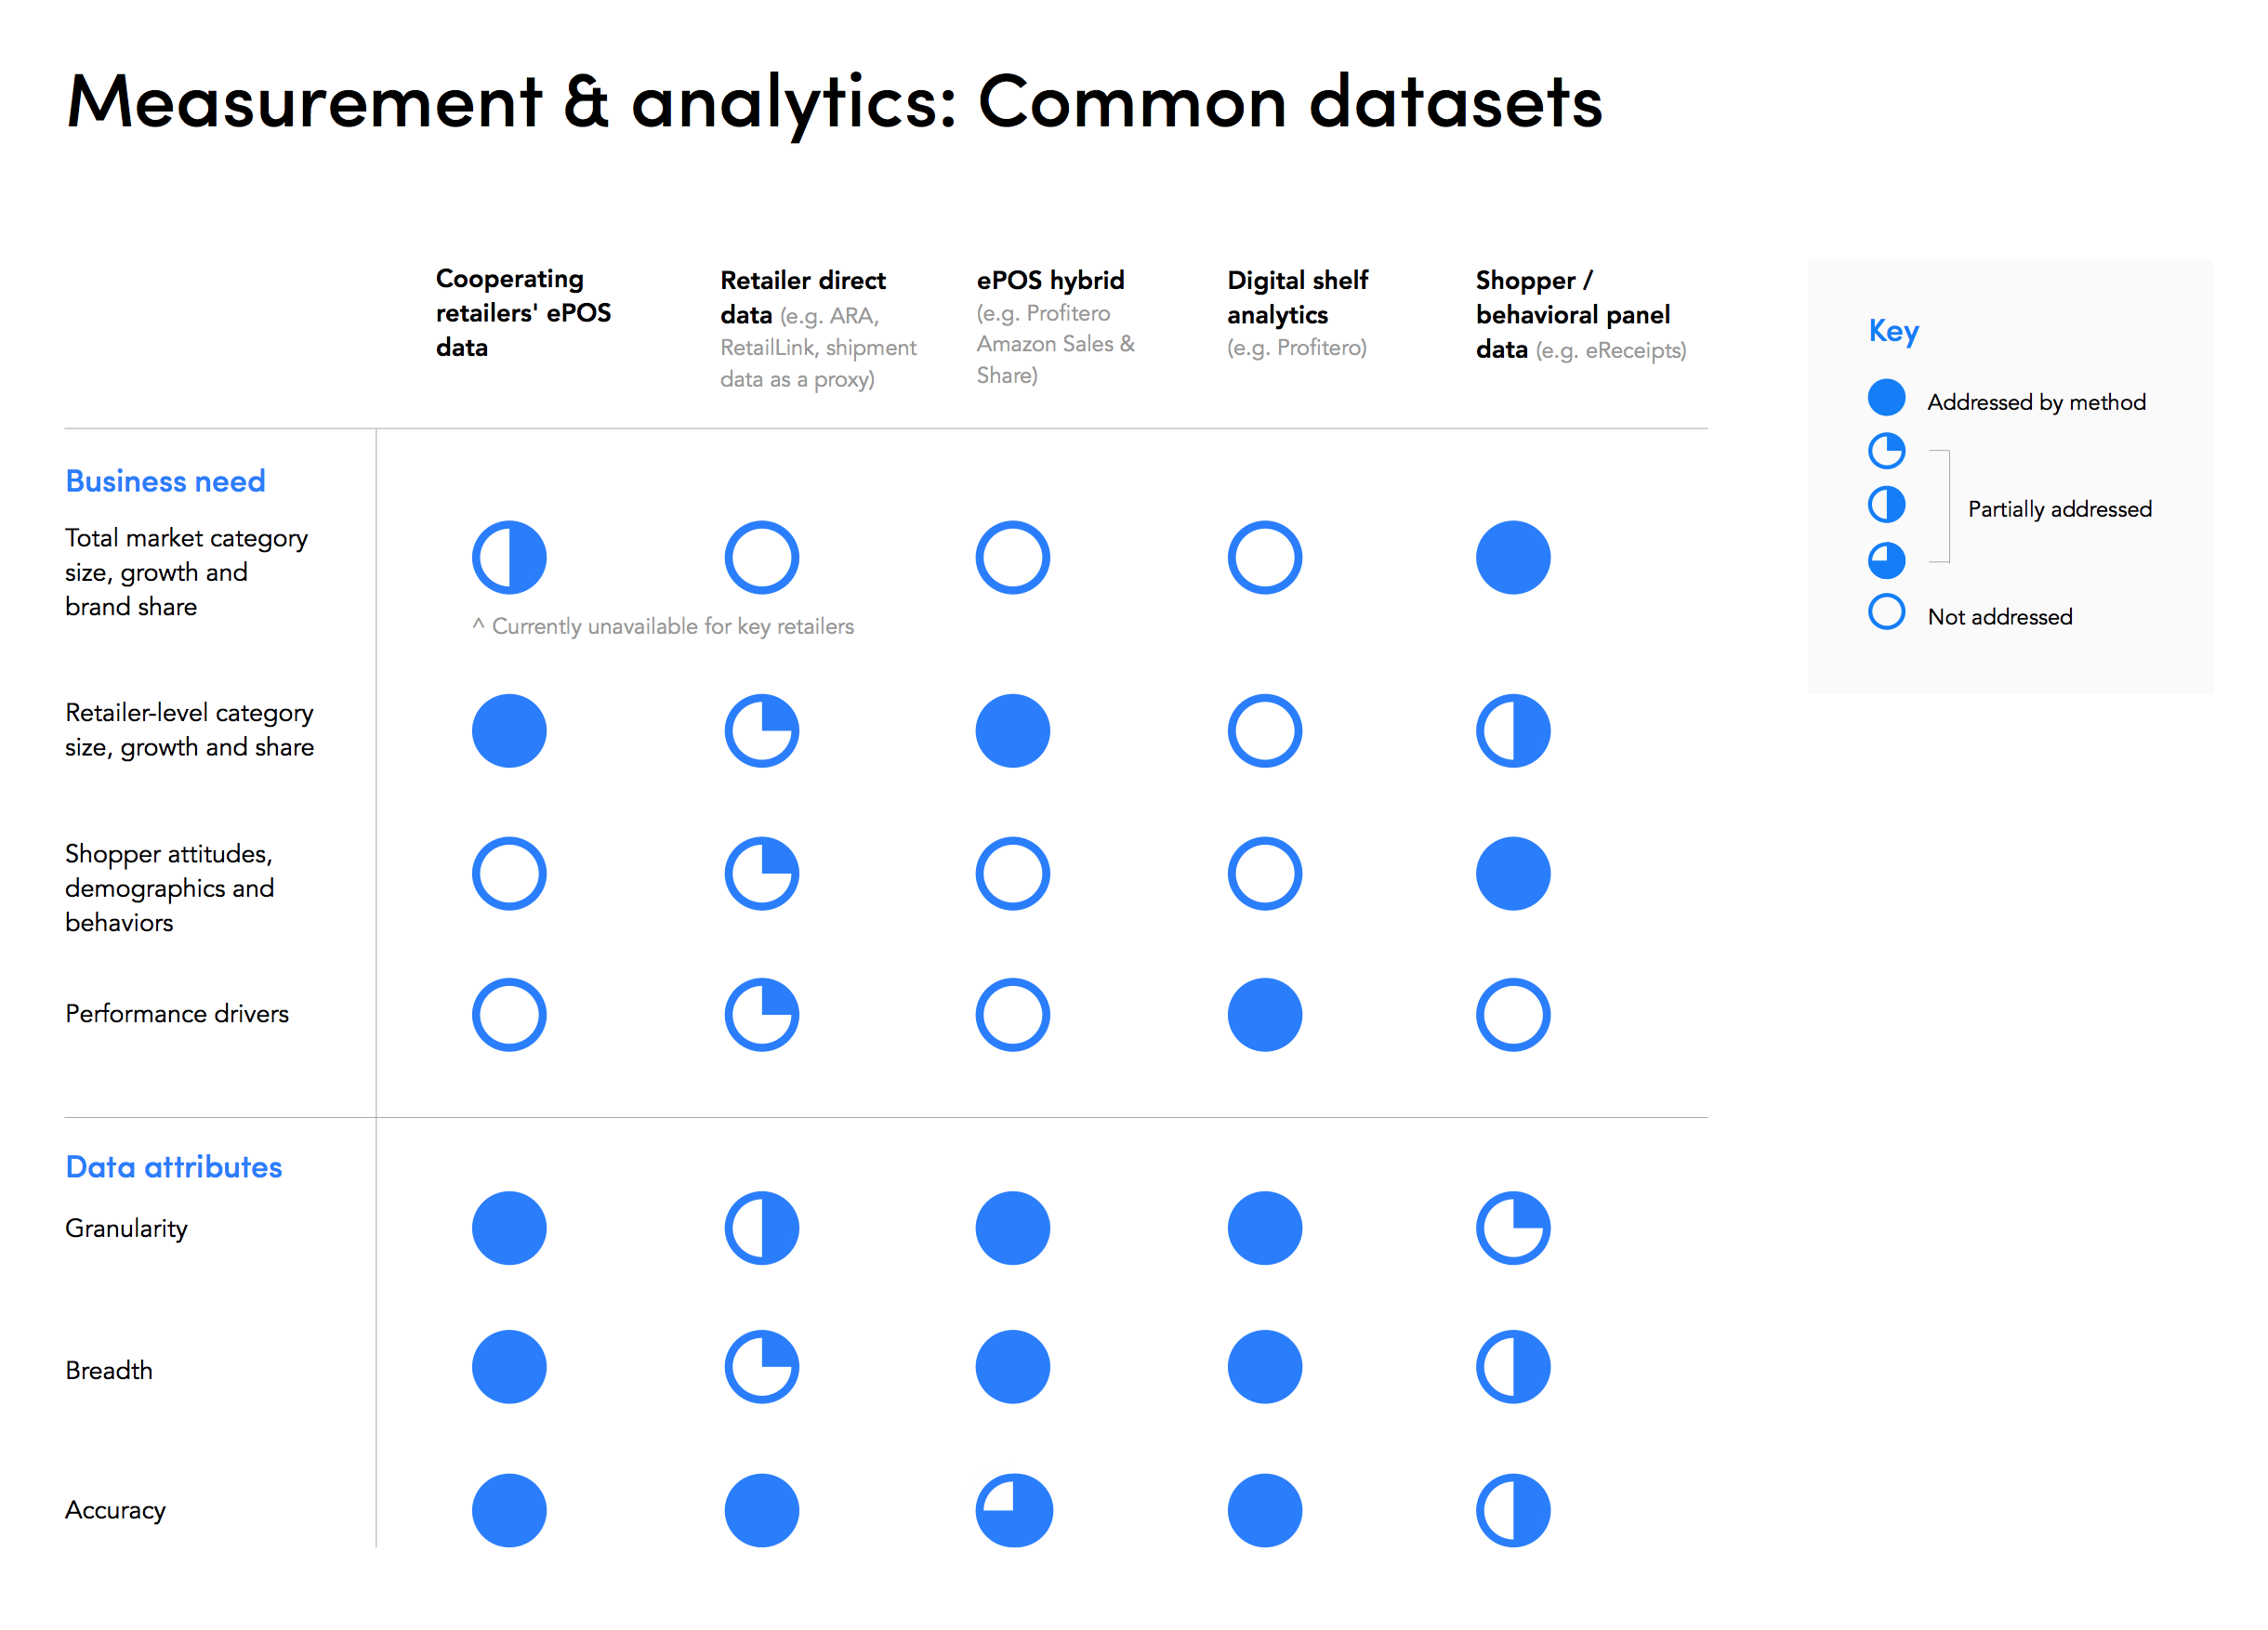
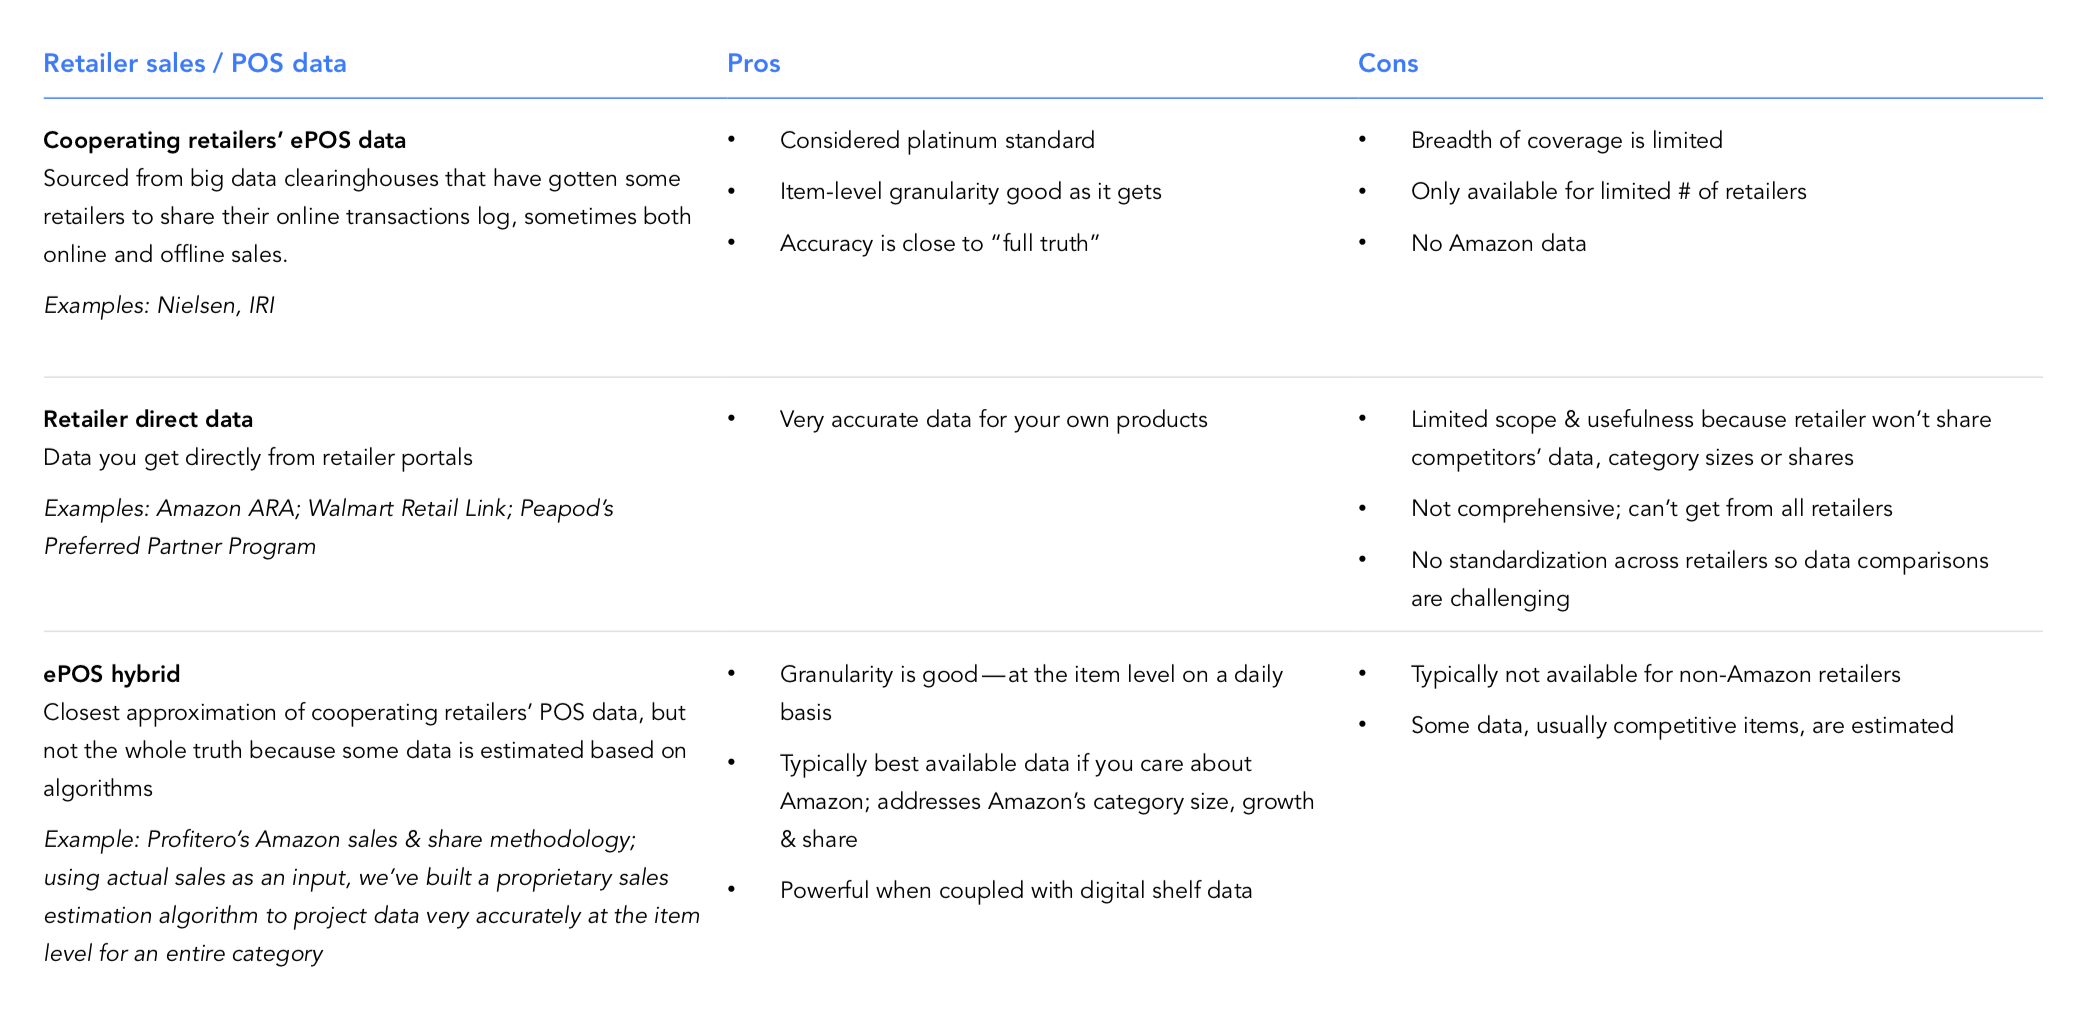
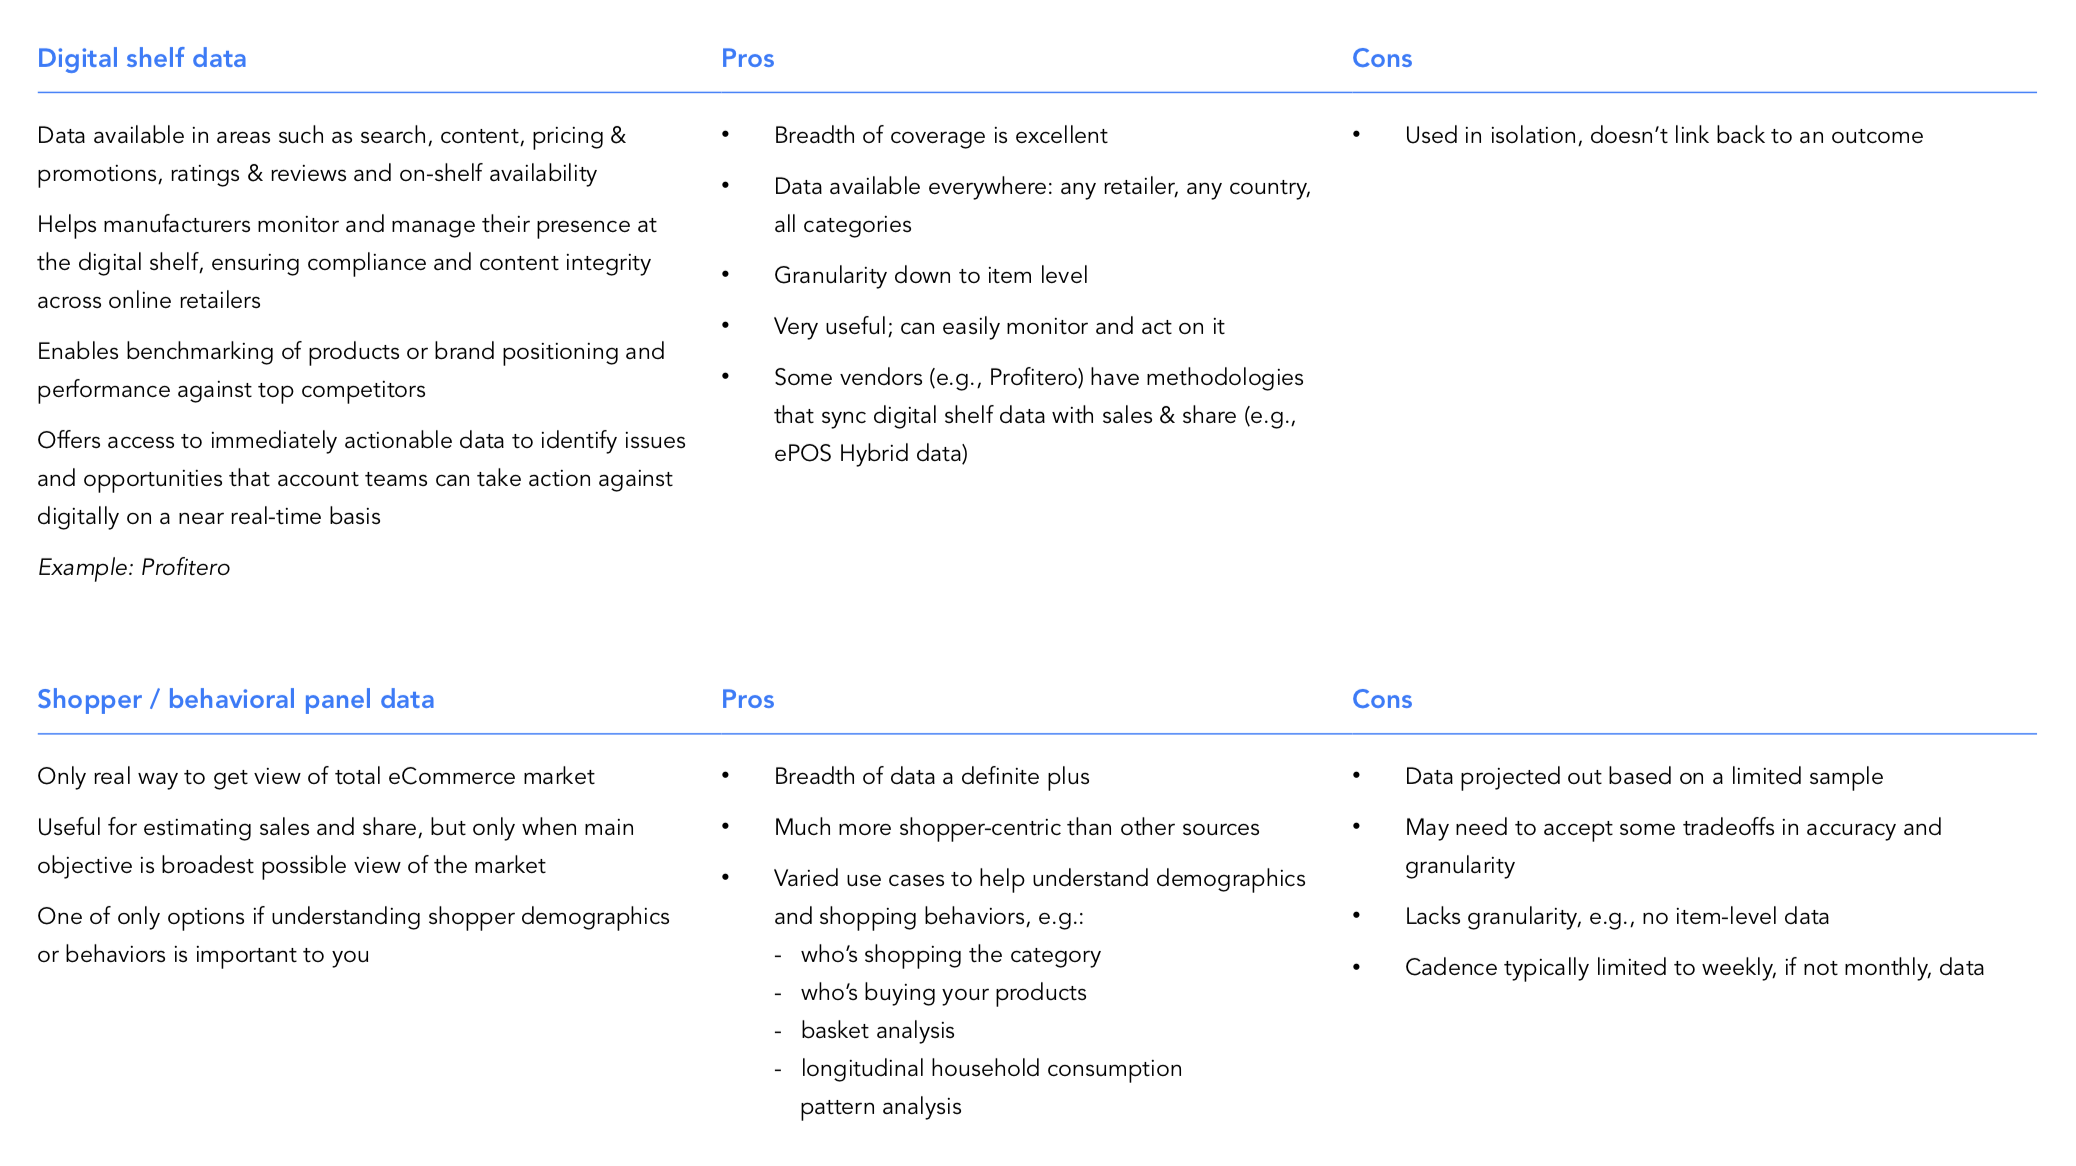
Drawing on Profitero’s years of eCommerce analytics experience working with hundreds of leading brands, some common datasets, their use cases, and pros and cons are depicted in the accompanying charts. There are three fundamental sources of eCommerce data:
- Retailer sales/POS data, with three main types of datasets falling into this bucket:
- Cooperating retailers’ ePOS data sourced from big data clearinghouses, like IRI or Profitero’s connected partner Nielsen
- Retailer direct data, with examples that include Amazon’s ARA data, Walmart’s Retail Link portal or Peapod’s Preferred Partner Program
- ePOS hybrid data, which is essentially what Profitero provides with its Amazon sales & share methodology
- Digital Shelf data helps manufacturers monitor and manage their presence at the digital shelf, ensuring compliance and content integrity across online retailers. In addition to Profitero, other examples of digital shelf solutions include Boomerang Commerce, Content Analytics and Numerator.
- Shopper / behavioral panel data is the only real way to get a view of total eCommerce market today, but only if the main objective is the broadest possible view of the market (i.e., the total market “read”). Panel data, like that provided by Nielsen, IRI or Kantar Worldpanel, is also useful for understanding shopper demographics or behaviors. Some types of panel methodologies specific to the eCommerce space include eReceipt monitoring, such as that offered by Rakuten Intelligence and Edison Trends, and browser monitoring from vendors like Hitwise and Similarweb.
The images below outline the strengths and weakness of each of these datasets. Please click on each image for a larger view.
What are the tradeoffs in datasets?
Depending on your company objectives, there are some factors to consider so you choose the appropriate dataset and data source. It really comes down to what type of data is most valuable or applicable to your business needs and specific use cases.
The big tradeoffs in datasets revolve around granularity, cadence, breadth and accuracy.
- Granularity means to what degree of detail is the data available, i.e., how precise is the data in terms of what’s available — total market, retailer, category, brand or item level data?
- Cadence relates to the timing interval of the available data, i.e., how often is data available or updated: weekly or monthly, or more often like daily or even more frequently?
- Breadth indicates how comprehensive the dataset’s coverage is across a universe of retailers, categories, brands, etc. Can you get a limited amount of data across a large number of retail customers? Or do you get very deep data on a limited number (yet often perhaps the biggest and most important) retailers?
- Accuracy reflects the extent data can be validated and compared to other sources of truth. Is it accurate or only directional?
Some things to consider when stacking up the accuracy of datasets:
- Number of products included in the universe, which heavily impacts the accuracy of item-level sales and share estimates — i.e., is the total category adequately represented or just a small subset of the category (typically big, familiar brands with leading share in brick-and-mortar retail)? For example, each day, Profitero monitors data on more than 450 million product pages at more than 8,000 online retailers.
- Categorization of products — i.e., is it based on Amazon’s taxonomy or mapped to a custom hierarchy that your company utilizes (e.g., Nielsen’s hierarchy)? And who is responsible for the mapping, you as the client or your provider?
- Ability to decompose first-party (1P) and third-party (3P) sales, which is useful in understanding 1P/3P sales and share and pricing dynamics
Some other factors to consider — which could impact how well various datasets can be aligned or integrated — include metric comparability; object/item matching, categorization and hierarchies; and file formats, transfer protocols and deliverables.
A word about the data accuracy debate
One of the biggest distractions that can sidetrack any eCommerce program is the debate over data accuracy. This is a particular issue with Amazon sales and share data, which is often (wrongly) held to the same accuracy standards as brick & mortar point of sales data you get from a Nielsen or IRI.
While Amazon sales and share data can be highly accurate and highly reliable, it’s never going to be flawless. Simply put Amazon sales and share data is not the same as Nielsen or IRI POS data, so appropriate expectations must be set.
Brick & mortar stores like Walmart or Safeway contract with Nielsen and IRI to provide POS data for all the products it sells, which is organized, categorized and resold to manufacturers. This data is as pure as you can get since it comes directly from the retailer. Unfortunately, Amazon doesn’t have such “retailer cooperation” agreements in place. Instead, it provides sales data directly to suppliers through Vendor Central — but only data that’s specific to your brands, not anything reflective of the whole category.
So, your only way to get Amazon category share is via analytics providers that model and estimate it. At Profitero, this is done using sophisticated algorithms and data collection technologies that ingest your Amazon sales and share from Vendor Central as one input and combine it with other “demand signals,” like Best Seller Rank and price, to triangulate competitor sales. The resulting data is similar to brick & mortar POS data that you’re familiar with in that it can be reported at the product level, and rolled up to the brand and category level. Unlike POS data, it’s estimated not actual sales. But it is a close proxy, within about 90% of actual sales — pretty reliable based on eCommerce data standards.
How do you align and integrate disparate datasets?
As you’ve probably realized by now, there is no single source of data that’s appropriate for every scenario or that’s available to cover all business needs. You’re most certain to have data from multiple sources, e.g., digital shelf data, eCommerce sales and share data, but also data that covers brick-and-mortar retail.
How do you align and integrate that data in a practical way? Based on our experience, most manufacturers use some combination of the following:
- In-house eCommerce data analysts. Having dedicated eCommerce data analysts is common for manufacturers, regardless of industry vertical. Our analysis of LinkedIn profiles across 100+ global manufacturers (sales $65+ million) found every company had at least one full-time dedicated data analytics role. Furthermore, eCommerce Data Analytics headcount is up dramatically (+103%) from a year ago, with more hiring underway. Our 2018 benchmarking survey reveals that 41% of companies plan to add dedicated headcount in eCommerce data & analytics in the coming year.
- BI platforms. Many people inside your organization — from consumer insights, shopper marketers and category managers to brand managers, supply chain specialists and heads of sales — will want to view data differently to extract value specific to their own need case. We see a growing roster of companies deploying business intelligence (BI) tools (e.g., Tableau or QlikView) to make this happen.
- Hire agencies, brokers or consultants. Integrating and aligning disparate datasets is a good use case for hiring agencies, brokers and consultants who can work with you on a contingency or project basis to meet your business objectives.
- Invest in a near-integrated solution. For example, at Profitero, we’ve worked hard over the last several years to integrate Amazon sales & share data deeply and seamlessly with digital shelf data to enable causal analysis. As a Nielsen Connected Partner, our data can also be mapped to Nielsen hierarchies so it can be viewed through a familiar lens.
What’s next?
As your business and commitment to eCommerce grows — and data, measurement & analytics become increasingly critical elements to managing performance, and hopefully outperformance, online — a strong rationale emerges for consolidating with fewer providers whose solutions integrate seamlessly.
One good reason for consolidating with fewer vendors, or even a single provider that offers 80% of the highest-value functionality you need that’s currently represented by two or more point solutions, is the sheer reduction in complexity. It’s difficult for a team to master multiple diverse tools that in the end may not even synch up and “talk” to one another. A single solution can increase adoption levels and usage substantially, and likely lead to increased productivity and scalar efficiencies.
Another reason in favor of consolidation is that it can streamline workflows that previously required significant manual effort. For example, reconciling and appending digital shelf data from one provider to sales and share data from a separate provider is a labor-intensive process that can be made considerably more efficient by a provider that handles both datasets in a single, integrated platform.
We’re always interested in learning more about how brands use eCommerce data analytics to drive business decisions and how it’s being operationalized within organizations. Please reach out to Profitero if you have feedback or would like to chat.
About the Author
Sandy Skrovan leads content marketing efforts for Profitero, a venture-backed global provider of ecommerce intelligence for retailers and brands. She can be reached on LinkedIn.


Hi Team,
your all posts are really helpful to get more inside of cpg & retail analytics. can you please share some test cases for dashboard and modelling related to cpg.
thanks in advance
Can you be more specific about what kind of modeling? That’s a very broad topic! We do have some posts on visualizations (summarized here). That’s related to dashboards but we don’t have specific examples to share of actual dashboards.