
This is a follow up to this previous post that dealt with why you need to be very careful when comparing manufacturer shipments to retail sales (also called consumption or takeaway or POS data). Once you are sure that 1. periods are aligned properly, 2. geography and product definitions are as close as possible and 3. unit of measure is the same between the shipments and retail sales, the last thing you need to do is calculate the coverage factor. This is a number that is used to adjust retail sales (usually) upward to account for any stores/channels that the manufacturer sells to but are not covered by the syndicated data supplier. Then you can look at shipments vs. retail sales and more clearly understand the inventory position of retailers which can help improve a manufacturer’s forecasting accuracy. (Note that if you are looking at retail sales data coming directly from the retailer itself, then a coverage factor is not necessary.)
The charts above illustrate a pattern where a coverage factor is necessary and appropriate. On the left, you see actual shipments and retail sales – note that the shipments (in red) are consistently higher than retail sales (in blue) so we know there must be shipment volume that is not accounted for in the outlets covered by the retail sales data. Although retailers often accumulate inventory over short periods (that’s another reason shipments can outpace retail sales) that excess inventory would eventually be sold through and the pattern wouldn’t persist for such a long time. On the right, you see shipments and adjusted retail sales, which is more likely to be the situation in real life.
Here’s a summary of the steps to calculate a coverage factor and create adjusted retail sales:
- Get correct data for shipments and retail sales
- Arrange the data in Excel to make the calculations easy
- Calculate rolling annual totals
- Calculate coverage factor
- Calculate adjusted retail sales
Get The Data
If you haven’t already, read this previous post for more detail on making sure the shipments and retail sales data are as “clean” as possible. You need AT LEAST one full year of monthly data and more data is better for this. Note: For a new product, you should not calculate coverage factor until it’s been selling at retail for at least year.
Set Up The Data
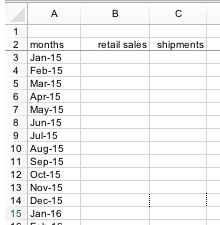
Arrange the original data so the period names are in column A, retail sales are in column B and shipments are column C, like this:
Calculate Rolling Annual Totals
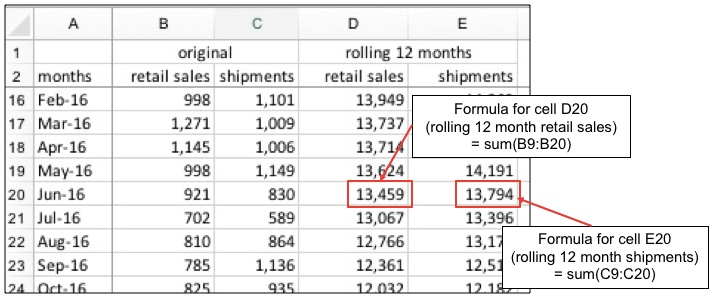
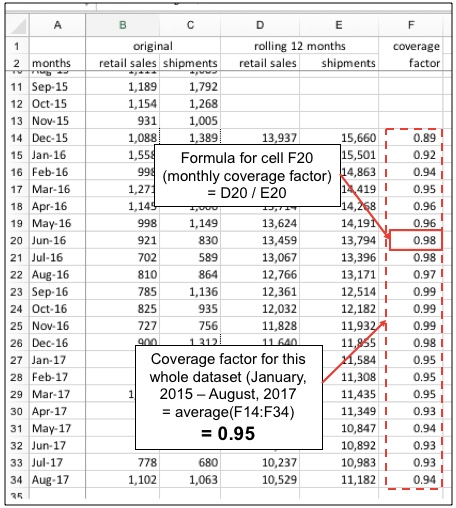
In columns D and E, calculate rolling 12-month retail sales and shipments. You would expect retail sales and shipments to be pretty close to equal over a long period of time but not on a monthly basis. Rolling means adding the 12 months of data, ending with the row you are in. So…in the row 14 for December, 2015, the rolling 12-month aggregate is the sum of January, 2015 through December, 2014. In row 15 for January, 2016 the rolling 12-month aggregate is the sum of February, 2015 through January, 2016. The first rolling 12-month total in this example has to be in December, 2105, since that’s the period that has 12 months of data to roll up. Copy the rolling 12-month formulas down for all the months that you have. (Note that if you have a database with 13 4-week periods in a year than you should use rolling 13-period aggregates. The point is to get to annual numbers.)
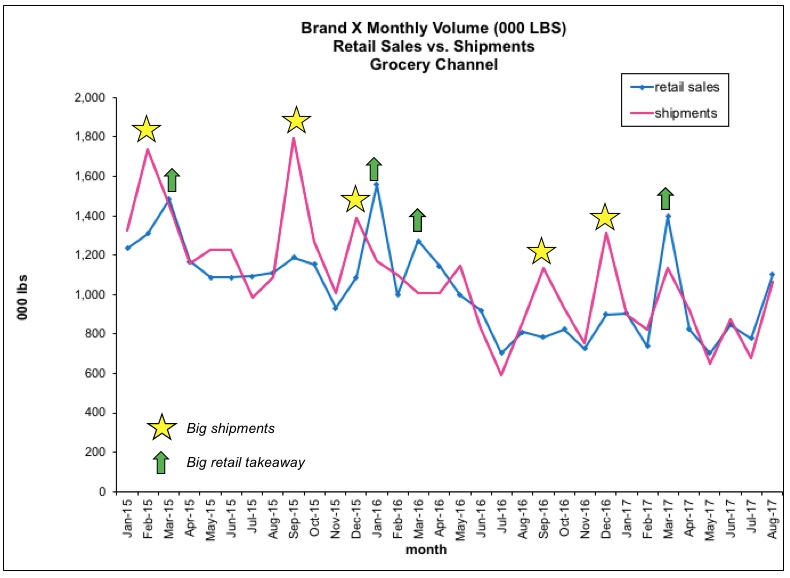
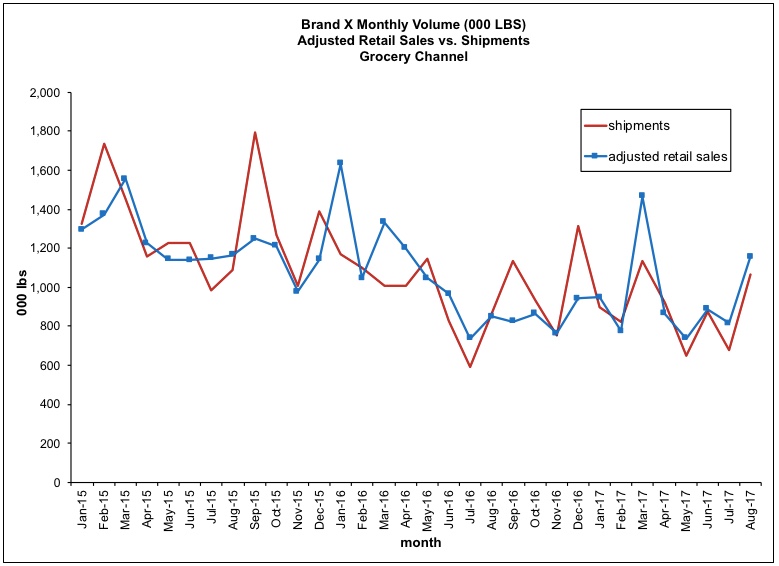
The chart below shows what the data looks like month-to-month. You can see that the shipments spike before the retail sales do. But you can also see that shipments are almost always higher than retail sales every single month, which would result in retailers building up lots of inventory over time.
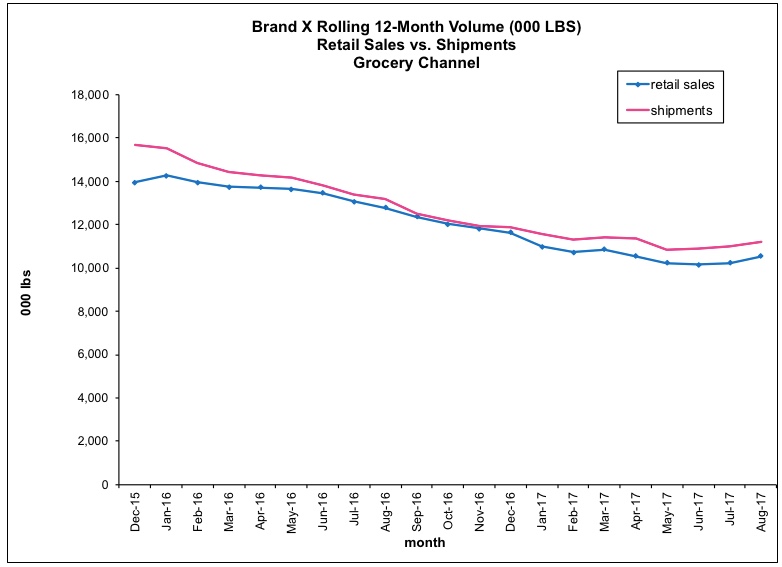
And when you look at the rolling 12-month data, you can see that shipments are consistently higher than retail sales:
Calculate Coverage Factor
In column F, calculate the coverage factor for each month.
coverage factor = rolling retail sales / rolling shipments
(= col D / col E in the example)
The coverage factor for this whole dataset that contains 32 periods (January, 2015 to August, 2017) is 0.95, which is the average of all the coverage factors that we have. Even though there is a slightly different coverage factor each month, you want to use a consistent one for all periods in a given analysis. (I have seen too many cases where people adjust the coverage factor month to month in order to make the adjusted retail sales look like they want it to – please don’t do that!)
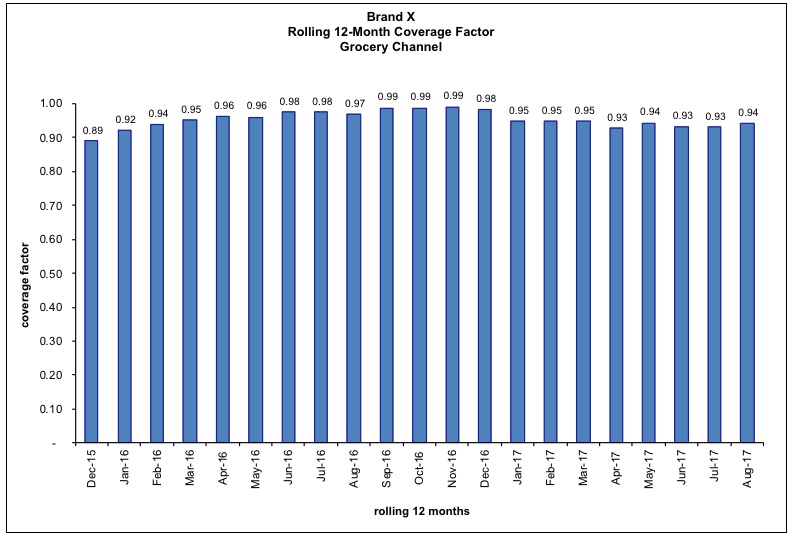
Here’s what the monthly coverage factors are for the example. This is very typical – they are in the mid-high 90s. Because they bounce around a little month-to-month we take the average to use to adjust the retail sales.
Calculate Adjusted Retail Sales
Now that we have the coverage factor, we can calculate the adjusted retail sales that are directly comparable to shipments.
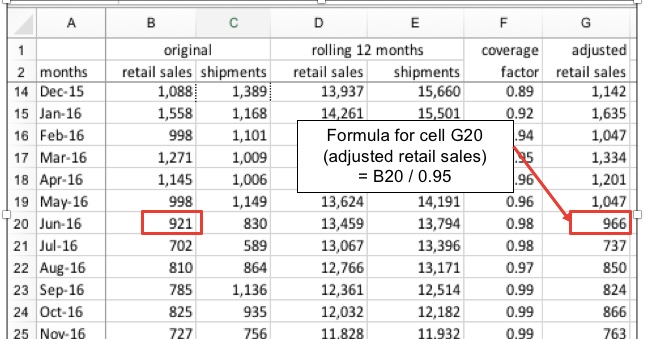
adjusted retail sales = retail sales / coverage factor for the whole dataset
(= col B / 0.95, in this example)
Now when you compare the shipments to the adjusted retail sales, the long-term retail sales and shipments are more similar and the retail trade is building up inventory in some months and drawing down their inventory in other months.
If you have other specific questions, please ask in the comments to this post and I’ll respond here so other readers can also see the answers.
Did you find this article useful? Subscribe to CPG Data Tip Sheet to get future posts delivered to your email in-box. We publish articles about once a month. We will not share your email address with anyone.

Hi
Very helpful post. Can you please help me understand what is building up inventory and drawing down inventory ? Also in the example stated above which months portray the same? 🙂
Retailers are building their inventory in a period when shipments are greater than adjusted retail (POS) sales. Conversely, retailers are drawing down (also known as depleting or pulling from) their inventory when shipments are less than adjusted retail (POS) sales. In the example, one period where retailers are building inventory is Sep15 and one period where retailers are drawing down their inventory is Mar17.
Hope that helps!
Coverage formula, only work if the previous data has a similar pattern to recent data?
Do you use the average of Coverage factor to predict the shipment quantity?
The part of the post that talks about taking an average of the coverage factors over time helps smooth out differences over time in the pattern. The shipment quantity can be predicted by first applying the coverage factor to the POS/retail/takeaway data and then making an adjustment for typical change in retail inventory.
Hi Robin, can you Plz explain the point below.
I have seen too many cases where people adjust the coverage factor month to month in order to make the adjusted retail sales look like they want it to – please don’t do that!)
There should be one consistent coverage factor used for all months within a given year. Even though the calculated consumption/shipments is different every month, you want to take the average across the months. The point of the coverage factor is to adjust for the data supplier’s coverage of retail outlets which does not really fluctuate every month. Hope that helps!