
Over the last year, we’ve written lots of articles showing you how to use key IRI/Nielsen measures. In this post, I’ll pull together several of those lessons in a step-by-step mini case study. The goal of this analysis is a common one: convince a retailer to increase the number of varieties for our target brand.
For each step, I’ll reference blog articles that explain everything you need to recreate a particular chart. Keep in mind, of course, that this will be a simplified version of a real analysis. And that the brand, retailer, and data are all fictional!
A Mini Case Study: Charlie’s Chips
Our analysis starts with snacks brand Charlie’s Chips. Charlie’s Chips come in a variety of flavors and enjoys good distribution in many major retailers. Its original flavor is the strongest in the line.
The Charlie’s Chips brand manager conducts an internal analysis of distribution voids and decides that the level of distribution for some flavor varieties could be improved. This is particularly true of the retailer MegaShopperMart, which is missing three flavors of Charlie’s Chips. References: % ACV Distribution, Identifying Distribution Voids
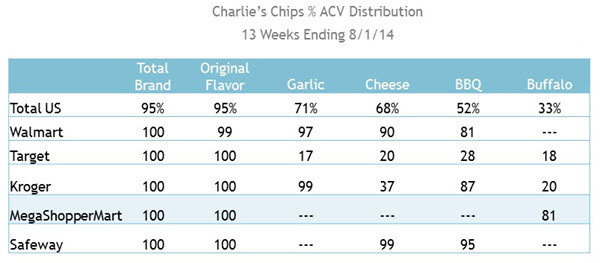
Note that this chart illustrates an internal analysis used only by Charlie’s Chips. IRI/Nielsen data contracts state that manufacturers are not allowed to show one retailer’s data to another retailer—not even if they mask retailer names.
How can the Charlie’s Chips team use IRI/Nielsen data to convince MegaShopperMart to add more flavors? The team hopes to show that adding more flavors will generate incremental Chips category sales. Their analysis path follows three steps:
Step 1: Look closely at MegaShopperMart Chips item sales
Step 2: Compare MegaShopperMart category metrics to competitors
Step 3: Tie category opportunity back to target brand
Step 1: Look closely at MegaShopperMart Chips item sales.
The Charlie’s Chips team pulls the MegaShopperMart ranking report to look at sales, distribution and velocity for each Chips item. References: Velocity 101
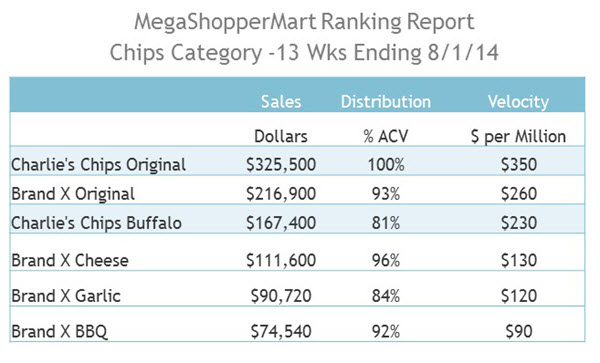
The ranking report shows Charlie’s Chips Original flavor is the top item, outselling the competition. So that’s good. But while the retailer stocks all the key flavors, it doesn’t carry all flavors from both brands. The team suspects MegaShopperMart is stocking too few SKUs to maximize category sales, but it has to come up with data to support its position.
Step 2: Determine how MegaShopperMart category metrics compare to competitors.
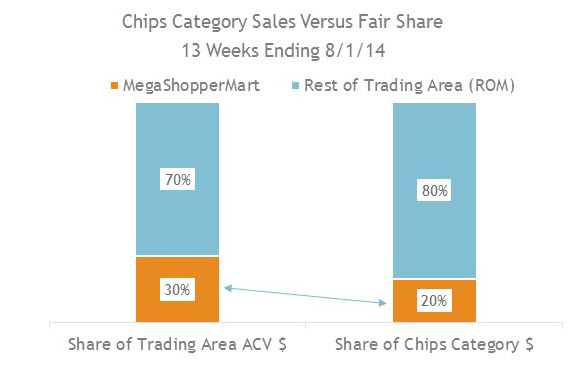
The Charlie’s Chips team continues their category assessment by comparing MegaShopperMart’s Chips sales to the remaining market. Is MegaShopperMart selling its fair share of Chips, or is there an opportunity gap? It turns out that MegaShopperMart has 30% of trading area ACV but only sells 20% of Chips category dollars. They have a 10-point opportunity gap in this category. References: Competitive benchmarking, calculating opportunity gaps
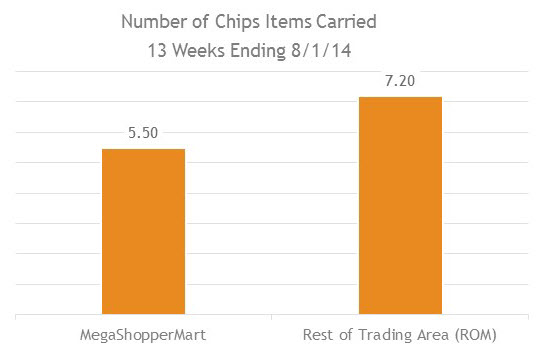
Further analysis reveals, as suspected, an issue with the number of Chips items carried by MegaShopperMart. The ROM averages significantly more items carried (7.2 versus 5.5). The Chips team can now build a case for more Charlie’s Chips flavors on the shelf. References: Average Items Carried
Step 3: Tie opportunity back to target brand.
The Charlie’s Chips team believes it has strong evidence to convince MegaShopperMart to add more items. The opportunity gap analysis is compelling and there is a big difference in the number of SKU’s carried. But how can it convince MegaShopperMart that the top priority should be more Charlie’s Chips flavors?
One piece of evidence is the original ranking report. MegaShopperMart carries both brands’ Original flavor and Charlie’s Chips is the stronger seller. Plus, the Charlie’s Chips Buffalo flavor has a stronger sales rate than all competitive items except Original. But for additional support for Charlie’s Chips superiority, the team must look again to the ROM data. The team decides to compare the velocity by item for the ROM. In every case, when comparing like flavors, Charlie’s has the stronger sales rate. References: Velocity 101
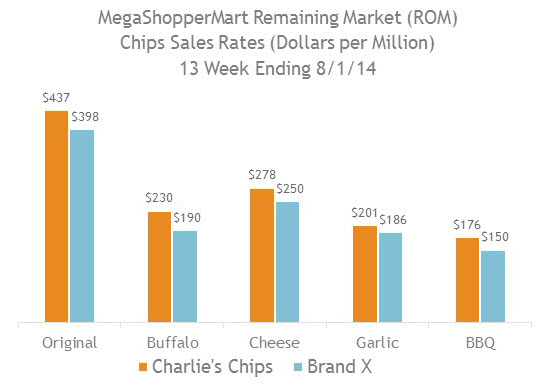
Now the Charlie’s Chips team has a complete analysis to take to MegaShopperMart. It can make a fact-based recommendation that MegaShopperMart increase category sales by adding more flavors of Charlie’s Chips. It can illustrate that MegaShopperMart has an opportunity gap in this category, that the retailer is carrying significantly fewer items than competitive chains, and that Charlie’s Chips is the strongest brand in the category and, therefore, the best source for new items.
Of course, in the real world, the Charlie’s Chips team would want to look into other issues, such as price points and level of promotion. In addition, any fact-based recommendation would ideally include an attempt to quantify the dollar value of the recommendations.
But this simplified example provides a starting point and an illustration on how to put together all the tools we’ve covered into a longer, most sustained analysis. Replicating this analysis for your brand is a great place to begin any category assessment.
Want help with your category assessments? We provide training, consulting, and data analysis. We’ll help you increase your return on your syndicated data investment. Contact us to learn more about our services.
Did you find this article useful? Subscribe to CPG Data Tip Sheet to get future posts delivered to your email in-box. We publish articles once or twice a month. We will not share your email address with anyone.

To your point about quantifying the $ opportunity of listing the additional items. What would be the best way to calculate an ROI for listing them? I can think of using each items $ sales from within the ROM. Does that make sense or is there a better way? Using the 10 point opportunity gap at the total category level doesn’t seem specific enough. Thank you!
My approach would depend on how many items I was suggesting they add. If I were suggesting one item, I would ballpark a velocity estimate for the new item and multiply that by the expected distribution. To estimate velocity for the new item, I would look at velocity in the ROM, velocity for other items in the target retailer, and also incorporate some cannibalization factor unless I had reason to believe that the new item would be entirely incremental. If I were suggesting several new items, I might come up with a new brand or category velocity estimate rather than estimating each individual item. And if I were you were pretty confident that the whole gap was created by too little variety, then the whole 10 point gap would actually be a reasonable estimate of potential gains. In my experience, the key is to come up with something plausible and present it as more of a “what if” exercise rather than a forecast unless you feel very confident in your impact estimates.
Thank you Sally! Makes sense.
I would like to clarify regarding multiplying product’s ROM Velocity by expected Distribution. I thought SPPD and Sales per Million both control for Distribution, therefore already accounted for in the $ upside estimate.
Here’s an example of what I meant, using SPPD since it’s simpler to make up numbers for that measure. Suppose you believe, based on your analysis, that the new item will attain SPPD of $1000. Now you need to make an assumption about the likely distribution level. If you think it will be 80%, then retail sales opportunity is $80,000. If you think 90% distribution, retail sales opportunity is $90,000. Let me know if that helps!
How do I determine the value of increasing ACV? Using the example above, what would be the value of moving Charlie’s Chips Buffalo from 81% ACV to 100% ACV?
The most optimistic estimate would be incremental % ACV * ACV for the retailer * dollars per million. In this case, that would be 19% * retailer ACV * $230. The retailer ACV number wasn’t included in the case study but you can find that number in your database or it can be estimated from other measures – search for my blog post on that topic for more details on how to calculate retailer ACV.
Of course, it’s unlikely that all sales for the new item will be be incremental – new Charlie’s Buffalo Chips shoppers will likely be switching at least some of their volume from another chips item. You can include some type of assumption on cannibalization. But you can also just position the optimistic value as “maximum potential gain” from the distribution increase.