Last month, we were delighted to present a webinar through the Category Management Association. The webinar content was inspired by our inflation post from earlier this year. We wanted to share both the video replay and our slides from the CMA webinar. In addition, in preparing for the webinar, we had a few additional thoughts on inflation:
Where Is Inflation Heading?
In our last post, we talked about where inflation numbers come from and how to track them. But we didn’t touch on inflation forecasts. There are many forecasts around from a variety of sources so keep your eyes open to see how forecasts might be changing as the economic situation evolves.
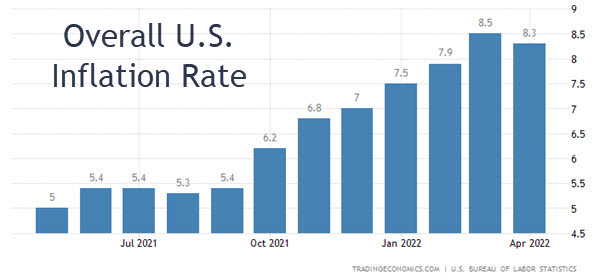
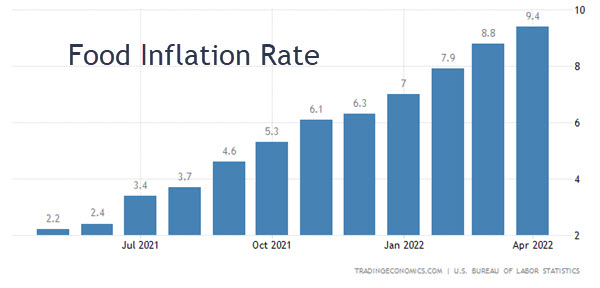
Looking at the most up to date numbers from the Bureau of Labor statistics, overall inflation has (likely) peaked but food prices are still rising.


Note: These charts, which illustrate U.S. data from the Bureau of Labor Statistics, are courtesy of Trading Economics, a fantastic compilation of global economic and financial statistics with very user friendly formatting!
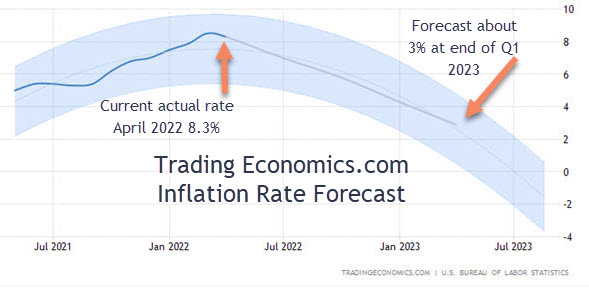
What’s coming for this key economic measure? This Trading Economics inflation forecast is pretty typical, showing the inflation rate declining but still higher than ideal into 2023. Their website states: “despite the slowdown in April which suggests that inflation has probably peaked, inflation is unlikely to fall to pre-pandemic levels any time soon and will remain above the Fed’s 2% target for a long time as supply disruptions persist and energy and food prices remain elevated.”

When will things be back to normal? The Congressional Budget Office (CBO), a non-partisan agency that produces economic analysis for the U.S. budgeting process, recently projected that inflation “slows in 2023 and 2024 … nearing the Federal Reserve’s long run goal of 2 percent by the end of 2024.”
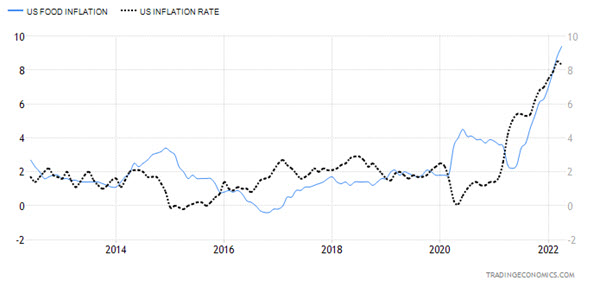
FYI, the Federal Reserve aims to keep inflation at 2% because they believe that lower rates of inflation risk pushing the economy into a deflationary environment (in other words, prices are going down), which is deadly for economic growth. So slightly rising prices are considered optimal and 2% inflation is considered “normal”. You can see in this 10 year chart, which shows inflation rates overall and for food specifically, that pre-pandemic inflation was averaging about 2% for both of these measures.

Should I Use Historic Or Current Price Elasticity Estimates?
Many companies have historical estimates of price elasticity from before the pandemic (2019 or earlier). Price elasticity estimates are created by conducting statistical analyses that control for factors other than price and then isolating the expected volume impact from a change in everyday price. A more detailed explanation of elasticity estimates can be found here.
So which is better to use: an older, pre-covid estimate or a more recent estimate that might have somewhat unusual consumer behavior due to covid but better reflects the current price landscape on the shelf? We can’t give a definitive answer, because it’s a judgement call that would differ for each product. But here are our thoughts.
If product selection and consumer preferences have changed a lot since your last price elasticity study and you have a recent data period with stable distribution, then updating those values is a good idea. Our general recommendation, though, would be to exclude the most intense pandemic period of April-June 2020 from your analysis if you are using a recent estimate. The exact dates to include and exclude might differ for your particular category but try to use at least 18 months of history while still avoiding extremely atypical data points.
If you have an older estimate and don’t have the money to update it or don’t think things have changed substantially in terms of price position and product selection, then using an older elasticity estimate is a solid place to start when calibrating the potential impact of a price increase this year. Both Nielsen and IRI have drawn the conclusion, from looking across the many studies they have conducted across products and channels, that elasticity and price sensitivity were suppressed somewhat during covid but are bouncing back to pre-pandemic levels.
And we wanted to reiterate that you must look at retail price and retail sales when concluding anything about consumer price sensitivity. Manufacturer price increases may not get fully passed along to shoppers at all retailers or it may take a while. Some retailers are actually cutting select prices to attract more shoppers during this inflationary period.
Both Nielsen and Circana are solid sources for thought leadership on inflation so keep an eye out for those reports.
If you enjoyed this article, subscribe to future posts via email. We won’t share your email address with anyone.

[…] eCommerce landscape, at the cusp of inflation, is studded with price-sensitive shoppers. During the 2021 holiday season, for example, 46% of […]