![]()
Manufacturers are constantly introducing new products. Although you know which new products your own company is introducing and when, it is also important for you to keep informed about your competitors’ activity. Depending on the resources at your company, you can do anything from annual analysis to on-going monthly (or even weekly) tracking.
This is the first in a series of posts that show how you can use your IRI or Nielsen POS database to conduct an annual analysis of all the new items introduced in your category.
- Part I: How to Identify New Items ⇐ this post
- Part II: What to Include in An Annual New Item Summary
- Part III: How to Tell The “New Item Story” for Your Category
Was it here last year? Look at Distribution
Another way of asking “which items are new?” is “which items were already here last year?” The simplest way to answer either of these questions is to look at distribution for all items in the category in the current period compared to the same period in the prior year. If an item has distribution greater than 0 in both years, then it is not new in the current year. See this post for more on distribution.
Since the focus of this post is identifying any new items in the category, we will be selecting the largest available Total US market. (See this post on Total US markets.) If your business is not national and more regional, you could do this for a specific region, market or groups of markets. If you are calling on a particular retail customer, you may want to do this for that customer to see what new items they have taken on in the past year.
Run a query (IRI or Nielsen) that contains the following, making sure to have the Products in the rows and the Facts in the columns:

* It is best to use current month. Using the most recent week will understate the distribution for most items since distribution is based on where an item actually scans and not on where it is stocked. Using a 52-week value will give you the average distribution across all 52 weeks, including all the zero weeks before the item was out there, not the most recent.
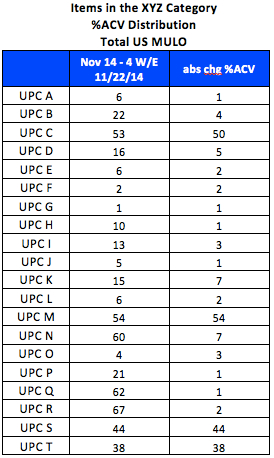
Your report will look something like this:

(Note that this example only shows 20 items in the category. Your category may have hundreds or thousands of items!)
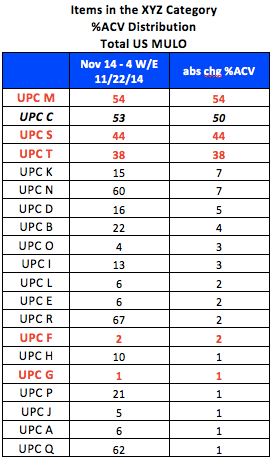
Looking at this, it’s pretty obvious that items M, S and T are new since their change in distribution is the same as their current distribution. Therefore, they were not in-market during this same period last year. If you sort the items in descending order of change in distribution, you can see that items F and G also appear to be new:

Obviously items M, S and T are the most interesting, since they are in relatively high distribution. Even though items F and G are also new, you may or may not want to do further analysis on them since they are in such few stores. You could add another column to this data in Excel that indicates if the current distribution meets some minimum threshold (like 5 or 10% ACV) and also sort on that to more easily focus on new items with significant distribution. But what about item C? The change in distribution is almost the same as the distribution itself (50 vs. 53). You may want to still consider this as a new item in the current year, even though it’s introduction began in the prior year. One more column in the file could calculate the change divided by current distribution so you can more easily find items similar to UPC C. Doing that would show 1.0 for all truly new items and 0.94 for item C (50/53) but only 0.47 (7/15) for item K and 0.12 (7/60) for item N.
Another thing to watch out for when identifying new items are special packs (also called in-and-out items) that tend to be in-market for short periods of time – like bonus packs, bundle packs or pre-price. Although these may show up in this type of new item analysis, they are really just variations of existing items. You can usually recognize such items by certain abbreviations in the product description (like +1.5OZ or 99¢ PP). It is important to be aware of such items but they are not really indicative of true innovation happening in the category.
Once you have identified the most important new items, you’ll have some natural follow-up questions like:
- Are the new items line extensions of existing brands or are they totally new brands in the category?
- Were the new items introduced just this month or several months ago? We can’t tell just from this data. Maybe that’s why distribution is so low for items F and G – they could have been introduced last week while items M, S and T have been around for almost a year.
- Are the new items regional or national?
My next post on New Items will focus on these and other things you’ll want to know about the new items.
Do you have a different way to identify new items? How often are you tracking competitive new items? We’d love to hear how you think about this. Please leave a Comment for this post.
Subscribe to CPG Data Tip Sheet to get future posts delivered to your email in-box. We publish articles every few weeks. We will not share your email address with anyone.

This is a great article.
I also like to sort based on brand or sub-brand. That way you can determine whether the new SKU is from a brand that is on your competitive watch list.
This can also be done for SKUs being discontinued as well as SKUs being replaced by a res-stage or some other action. We use this information in our MarketSim agent-based modeling and simulation software (www.ProRelevant.com) to analyze the success of prior competitive product/extension/brand launches. This helps us to determine how consumers in a category try different new offerings.
Great post.
Here is a message that we received from a reader that you may also find helpful:
“Thanks for today’s useful – and timely – article. We are ourselves in the midst of completing this process currently.
One additional dynamic that we face – as I expect many other companies do as well – is that the way we define our product category (Sports Nutrition) does not align perfectly with the way Nielsen and IRI define their categories (we find relevant products spread across categories like Supplements, Weight Control, etc.). As such, to identify the relevant new products in our space, we must complete a process along the lines of what you have laid out, but for multiple Nielsen/IRI categories, and then go through the results to determine what’s in/out.
This can be a time consuming process. There can be some systematic ways to cover large portions of the UPCs (e.g. all UPCs from a given brand are in/out), but often individual UPCs have to be analyzed based on their attributes (and potentially even reviewed in detail beyond what’s available in the data).
Just one more complexity many of us face as we work through this process. Thanks for the article – look forward to reading the next in the series!”
He makes some very good points! In case you missed it or are a newer subscriber, here is a post on defining your category from 2013:
https://www.cpgdatainsights.com/get-started-with-nielsen-iri/how-to-define-your-product-category-and-why-it-might-be-harder-than-you-think/
I just wanted to thank you for this website. I am a brand marketer and while I have been using syndicated data for over 15 years, I am a bit rusty on some of the more esoteric differences between certain measures. Your articles and glossary are so helpful that I felt the need to write to thank you for your great work!
Hi Robin,
I was just wondering if link for part 3 is been changed ? I am not able to see blog 3 of this series.
Part III: How to Tell The “New Item Story” for Your Category
Kindly Help,
Thanks,
Sumeet
I have not gotten around to writing part 3 yet. It’s on the list of future posts.
In Nielsen, there’s a distribution metric called “Fist week selling” that I use to track when an item first sold.
Yes! That is a very helpful measure that makes it easy to see when an item first sold. A related one is number of weeks selling which should be used when calculating any “sales per whatever per week” measures to account for new items that were not in distribution over the whole analysis period.