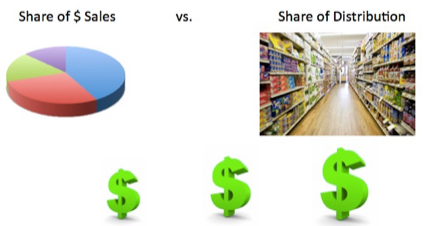
In a previous post, I explained the concept of “fair share of distribution” and how you can determine if your brand is getting the distribution it deserves.
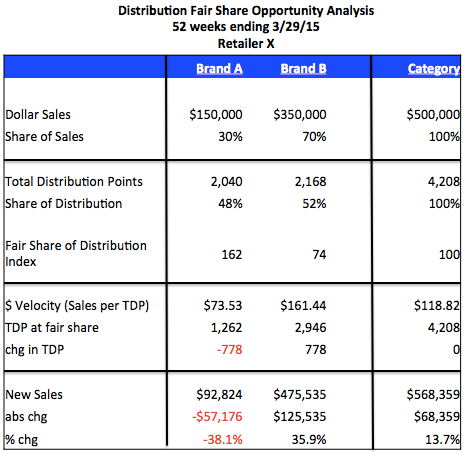
Now I’ll show you how to quantify the size of that opportunity, for both your brand and the category, if you are getting less than your fair share. Let’s use the dataset below. To keep things simple we’ll assume that these are the only 2 brands in the category. (If you aren’t familiar with the measures TDP and Sales per TDP, you may want to review those before continuing. Those measures will be used in the example below.)

Key takeaways:
- Brand B is not getting its fair share of distribution since it has 70% of the dollar sales but only 52% of the TDPs. This works out to be a fair share index of only 74 (= 52 / 70 * 100). Remember that if the index is under 100 (like this one is), then there is an opportunity to convince the retailer that you deserve more distribution.
- Brand B has a higher velocity than Brand A, $161.44 vs. $73.53. (Sales per TDP is just what it sounds like: sales / TDPs. This is $350,000 / 2,168 = $161.44 for Brand B.)
- Brand A has greater than its fair share of distribution, with an index of 162 (= 48 / 30 *100).
These 3 points taken together provide a great story for Brand B to gain/steal distribution from Brand A. This will increase Brand B sales by almost 36%, or over $125,000. Plus…category sales will increase by almost 14%, or over $68,000. (Unfortunately if you are Brand A in this scenario, you would lose distribution and sales would go down more than -38%.)
Here’s how to calculate those opportunities for Brand B and the category:
- Calculate what Brand B’s TDPs should be at fair share. (We will assume that category distribution remains at 4,208 TDPs.) If Brand B has 70% of dollar sales then they should also have 70% of the category TDPs, so
0.70 * 4,208 = 2,946
- Determine how many TDPs Brand B needs to get from Brand A to reach that fair share level, so
2,946 (fair share TDPs) – 2,168 (current TDPs) = 778
- Calculate the dollar opportunity for Brand B as the additional TDPs * velocity per TDP, so
778 * $161.44 = $125,535
And the percent growth over current sales is
(new sales – current sales) / current sales = $125,535 / $350,000 = +35.9%
- Calculate the dollar opportunity for the category as the difference in velocity per TDP between Brand B and Brand A * the number of TDPs that are changing from Brand A to Brand B:
($161.44 – $73.53) * 778 = $68,359
And the percent growth over current category sales is
+13.7% = $68,359 / $500,000
If you find that your brand is not getting its fair share of distribution and it has a higher velocity than a competitor, now you know how to use that information to convince a retailer to shift some distribution from that competitor to your brand.
Have other questions about how to quantify opportunities with specific retailers? Leave a Comment for this post and we will try to answer as best we can.
Did you find this article useful? Subscribe to CPG Data Tip Sheet to get future posts delivered to your email in-box. We publish articles about once a month. We will not share your email address with anyone.

Nice article.
But what if your brand is getting more than its fair share of distribution and is still in early stage of having been introduced in the market?
Is it good reason enough to bring down the distribution points?
If your brand is getting more than its fair share of distribution (for any reason), then you would not tell that to the retailers and you would not recommend that your own items be delisted. But…a competitor may show a retailer that your brand has more than its fair share of distribution and try to get you delisted to make room for more of the competitor’s items. In that case, if your items are new and have not yet reached their on-going velocity then you do have a case with the retailer to leave them in and give them a chance to improve. Hopefully after a full year in distribution things would even out.
Hope that helps!
Gayatri,
It has been my experience that you want to celebrate getting more than your fair share – with the retailer. Many take pride in their “speed to shelf”, especially on new items. Tie the ACV record to the retailer’s market share trend on your brand, and you may have found a customer niche.
Assuming that I BRAND A, how can I protect my Brand from Brand B doing what is shown in this article which is very insightful?
Good question! That is a situation where you have to get more creative with using the data! One way would be to use household panel data to show how loyal shoppers are to Brand A. There is a panel measure (called something like “% exclusive buyers”) that shows what % of a brand’s buyers only buy that brand. See if Brand A has more exclusive buyers than Brand B. If so, that means that those shoppers are likely to go buy Brand A at another retailer than switch and buy Brand B at the retailer you’re looking at. Another thing to look at is the specific flavor/size combinations that Brand A offers. If there are any unique items (flavor/scent/color is probably more important than size) that Brand A has that Brand B doesn’t that can be helpful in convincing the retailer to keep those Brand A items on shelf. Hope this helps!
Can I use this analysis only for brands? How should I proceed when I want to recommend changes on SKU/item level?
I tried to simulate it on SKU level but problem is that lot of SKUs with highest velocity and TDP share are already at 99% of distribution despite their value % being higher than %TDP.
So there is no possibility to expand their distribution anymore.
Or am I doing something wrong? Or how should I tackle it on SKU level?
Thank you
For quantifying distribution increases at SKU level, see this post. If a SKU has 99% distribution, it’s not a candidate for increased distribution. Look for SKU’s with strong velocity but lower levels of distribution – that will lead to you the biggest opportunities.
Unfortunately (or fortunately), my SKUs are already at 99% and I would prefer building the story that they need bigger support since they still deliver higher sales (% value share>%TDP). So is the only option increase in facings?
Increasing distribution of SKUs with lower levels of distribution seems that it prefers mid-size or smaller brands/SKUs and it is helping them to catch up to the big ones.
Obviously, it is on expense of tail SKUs which are strongly underperforming.
Is it your experience?
Am I seeing it correctly?
If all your SKU’s are at 99%, then you really don’t have distribution opportunities (as defined by %ACV in our post). As you say, there might be an argument for improving facings or something else about the planogram that would improve your product positioning. You would have to take a close look at the POG and syndicated data can’t help you there. You might use Robin’s analysis to see if you are vulnerable to those smaller competitors making this argument and stealing distribution from you, the category leader.
Super insightful article, and reading the comments clarified all of the questions I had. Just wanted to pop in and say thank you for the information!
Would it be fair to say your velocity gets impacted by the % change of your distribution?
E.g saturation or simply the brand will not sell the same across all stores.
Yes! It is common to see velocity go down somewhat as distribution goes up. That’s because the velocity in stores that are added is typically not as good as it is in stores where the brand/product has been around for a while.
Can I use this analysis for specific channels instead of retailer level? And can I use the market players instead of specific brands?
Yes, you can do this for channels instead of specific retailers but that would be for internal purposes to assess the size of the opportunity since there isn’t a specific entity that can implement anything to “fix” a fair share problem for an entire channel. When you say “market players,” if that means manufacturers (who own multiple brands), then yes, you can do this at that level. If I did not understand that part of the question correctly, then please clarify in response to this comment or send a message using the Contact Us link.