 Even if you never buy Nielsen/NIQ, IRI/Circana or Numerator panel data, you should still understand this common household level analysis. Retailers who analyze their loyalty card data will often use this approach. So you’re likely to be confronted by it at some point.
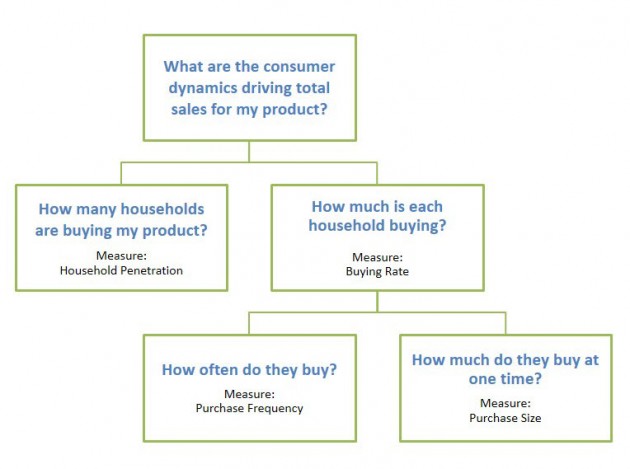
Here’s how it works: You break down total sales for a brand or category (or even a UPC) into its underlying purchase dynamics. The pieces are laid out in a tree chart, with Sales (Volume or Dollars) at the top. I’m going to call it the Sales Drivers Analysis but the same basic approach can come under lots of other labels (depending on the source). Purchase Summary, Market Summary, and Key Measures Report are three that I’ve seen.
The Sales Drivers Analysis uses four panel data measures: Penetration, Buying Rate, Purchase Frequency and Purchase Size. If you’re already familiar with these terms, read on. If not, here’s a post defining these measures which will bring you up to speed. These four measures allow you to separate how many customers you have from how much those customers bought. Here’s how that looks graphically:

How do you apply a Sales Drivers Analysis? You can use it to get a snapshot of your brand or category. But it is most valuable when you compare different time periods or product groups. Here are some examples:
- You have added several new flavors to your line. You want to see whether the new items brought in new buyers for your brand (increased penetration) or encouraged existing buyers to buy more (increased buying rate) or both. Compare the above four measures for your brand for the period before versus the period after your new items were introduced. Be careful about distribution of the new items. And, as with most analyses, you have to be aware of seasonality and other marketing factors that might be impacting buyers at the same time.
- You want to understand what role your category plays in the store and how it compares to other relevant categories. Are lots of shoppers purchasing your category frequently? Or do you have niche appeal but very loyal buyers? Or are you a more vulnerable product with limited appeal and infrequent purchase? Compare the above four measures for your category versus other categories. Make sure you use the same time period and geography.
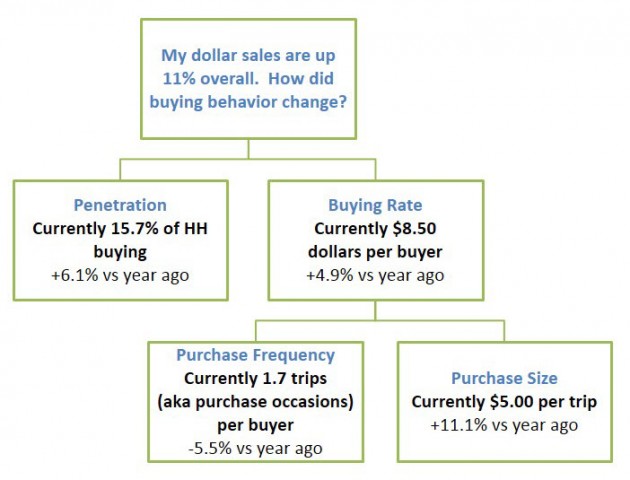
- Your sales are up (or down) and you want to understand which dynamics drove those increases (or declines). Compare your current penetration and buying rate to what you achieved in the year ago period. Here’s an example with real numbers. I started with dollars as my sales measure (that’s most common for retailers) but you can start with volume or units if that’s your focus:

For the product in this example, the biggest gains are in purchase size (aka sales per trip). Purchase frequency (aka trips per buyer) has actually declined. That may be expected, given changes in the marketing plan. Perhaps the brand experienced a price increase, added a larger size, or started multi-unit promotions. But it may also indicate some vulnerability or shift that concerns the brand team. It may be a warning flag that warrants additional analysis (using panel data or other tools).
Did you find this article useful? Subscribe to CPG Data Tip Sheet to get future posts delivered to your email in-box.

A fantastic break-down of fundamentals! Many people burn years trying to acquire what you boiled down to a basic lesson, well done!
Sally, This is great! I’ve found if you start here, and then investigate further, your time spent in analyzing a problem is greatly reduced!
Thanks for an awesome, easy-to-understand explanation!
Am learning so much from you post! Thank you!
Outstanding explanation.
Thank you Linda!
I have a question on how to back into Item Penetration as I’m trying to do some roll-ups and don’t want to average a bunch of averages. Is there a way to do this with other raw numbers like Item Buyers and Buying Rate? I’ve been trying on my own but am stumped. Thank you!
My understanding of your question is that you want to calculate penetration for a group of items. You have individual item penetration and want to know if there is a way to back into penetration for the group. The sad answer is no, you can’t do it, because you don’t know how many buyers bought more than one of the items. Penetration for the group of items would require an estimate of unique buyers and you don’t know the level of cross buying. One thing you do know is that penetration for the group of items is at least as high as the highest individual item penetration. It’s similar to the problem faced when looking at % ACV Distribution for individual UPCs and wishing one had % ACV Distribution for the whole brand – can’t be done.
Thank you for the response- at least I can sound intelligent now when talking to the issue!
Hello,
Just curious to know How is velocity different from frequency rate and how is distribution different from penetration?
Distribution is whether a product is on the shelf, available to be bought. Penetration is how many people buy the product. So if your distribution is 0, your penetration will also be 0. But the reverse if not true. So these measures will be strongly related but not perfectly correlated.
Velocity is how well a product sells, once it’s on the shelf. Velocity will be a function of both penetration and frequency. So if only one person buys a product, it will have low velocity, even if that one person buys it all the time. And if everyone buys a product but only every 10 years, that product will also have low velocity. Of course, “high” or “low” velocity is all relative! Low velocity in the grocery store could be high velocity in a hardware store.
Frequency is how often the product is bought by the people who buy it. So, again, you could have a product that is frequently bought by a relatively small set of people (a niche product) and that product wouldn’t have high velocity at the total market level. But it might be VERY important to a small set of people and they won’t shop your store if that product is not available. That’s why this is a useful diagnostic measure.
These differences are why it’s helpful to look at both store/POS based measures like distribution and velocity and panel based measures like penetration and frequency. The store and panel measures are often related to one another but they also measure very different dynamics.
is there a way to ask a question in private conversation?
You can email us through the Contact tab on the menu at the top of the site.