This is the second in a series of posts on how to quantify the impact of improving the various elements of consumers’ purchase behavior.
These purchase behavior analyses are based on household panel/shopper data (not POS/store data). Take a look at these posts if you need a refresher on this type of data:
- Overview of panel/shopper data
- The 4 basic panel/shopper measures
- Using panel/shopper data to understand what is driving the business
This post will focus on increasing purchase frequency. As a reminder, increasing purchase frequency is one of the 3 ways to increase sales of a specific brand:

Sample Business Situation and Question
By looking at some category-level shopper/panel data, the Charlie’s Chips teamdiscovered that shoppers are buying salty snacks more often this year than last year. Unfortunately, they are not buying Charlie’s Chips more often. Using shopper/panel data, the team can calculate how much sales would increase if the brand could capture some of these additional category purchases. In other words, what would the brand gain if purchase frequency could be increased? Note that in order to find out why shoppers are not buying Charlie’s Chips more often, the team needs to speak to shoppers directly via primary research. Depending on the answer to that, the brand could invest in an appropriate solution – like product changes/enhancements, more advertising, different messaging, more/different consumer promotions, etc.
Shopper/Panel Data Used (plus a quick review)
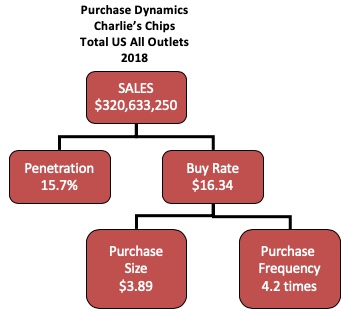
The Charlie’s Chips data I’m using in this post is is the same as in this example on how to quantify an increase in penetration:

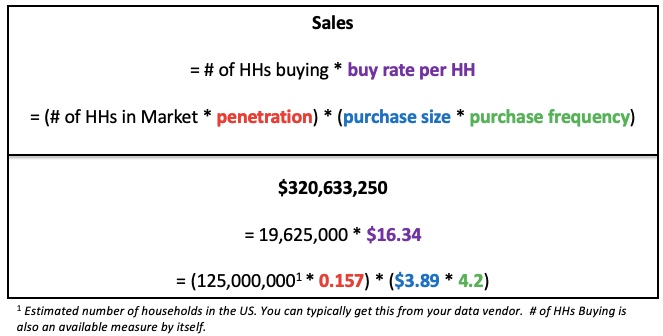
As a reminder, here are the relationships between the various measures above and how they relate to Sales:

Purchase Frequency (sometimes called Trips) is the number of times, on average, that a household buys the brand during the time period in question. If every single household in the US bought the brand once a week then purchase frequency would be 52. That never happens for any product – even milk! So in our example, a household buys Charlie’s Chips 4.2 times in a year. [Note: purchase frequency includes households that buy any number of times, including only once, which is a bigger group than you may think for most brands. But that can be a subject for another post.]
Quantify The Opportunity
We’ll quantify the opportunity in 2 steps:
- Calculate how much more could be sold if the current buyers purchase Charlie’s Chips one more time during the year than they currently do. In panel/shopper data lingo, this translates into an increase in purchase frequency by +1. I usually use “one more time” because that’s a very tangible action. In this example given that the average household currently buys about 4 times a year, if we assume they would buy 2 more times that’s an increase of +50% – too aggressive.
- Then, because it is not realistic to think that all current buyers will increase their purchases, you need to make an assumption as to what portion of the current buyers would increase their purchase frequency. For this example we’ll keep it simple and assume purchase frequency will increase by 1 for a 2 different portions of current buyers – 10% and 15%.
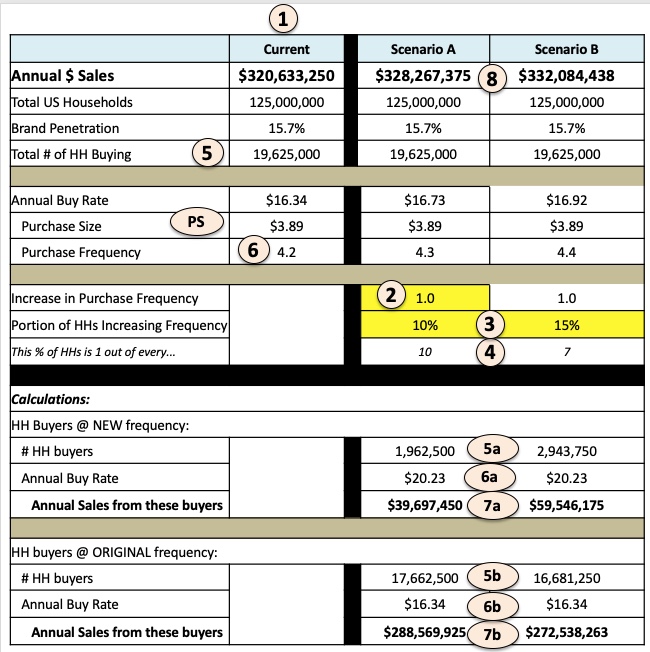
The table and instructions below show the necessary calculations to get to a reasonable estimate of how much sales would increase by getting some current buyers to buy the brand one more time a year.

1. Column 1 shows the current situation: annual sales of $320.6 million
2. In cell 2 I’ve entered 1, an increase of one additional purchase per HH
3. For the 2 scenarios, I’ve entered 10% and 15% for the portion of current buying HHs that would buy Charlie’s Chips one more time in a year
4. This makes the estimates in cell 3 more concrete, so 10% of buyers is 1 out 10, 15% of buyers is one out of 6.667 (rounding to 7).
Formula = 1/cell 3
5a. # of buyers at the new, increased frequency.
Formula = Total # HH Buying (cell 5) * cell 3.
5b. # of buyers at the original frequency.
Formula = Total # HH Buying (cell 5) – # HH buying at new frequency (cell 5a).
6a. Annual buy rate for buyers increasing frequency.
Formula = purchase size (cell PS) * purchase frequency (cell 6 + cell 2).
Their buy rate is $20.23, higher than the original $16.73 buy rate since they are buying one more time
6b. Annual buy rate for buyers not changing frequency.
Formula = purchase size (cell PS) * purchase frequency (cell 6).
Their buy rate is still $16.73.
7a, 7b. Annual sales.
Formula = # HH buyers (cell 5a or 5b) * annual buy rate (cells (6a or 6b)
8. Total Sales = sales from HHs buying one more time or not (cell 7a + 7b)
Note that we need to inject some reality here, which may not always be welcomed by your Marketing team (!). Of course it is not realistic to think that all current buyers will buy Charlie’s Chips one more time so you need to make an assumption as to what portion of the current buyers would do that. There is no science behind this – this is the “art” part of analytics being a combination of art and science. I recommend calculating several scenarios with different portions of buyers changing their behavior. You could also run scenarios that show 10% of buyers buying 1 more time plus another 10% buying 2 more times. This methodology will give you a well-grounded estimate of the range of increased sales to be expected.
Click here to download an XLS file that allows you to quickly calculate the impact of changes to purchase frequency and portion of buyers that increase their frequency like in the table above. Once you have saved this file, you can modify it to allow for multiple buyer groups – those who increase purchase frequency +1, +2, etc.
Did you find this article useful? Subscribe to CPG Data Tip Sheet to get future posts delivered to your email in-box. We publish articles about once a month. We will not share your email address with anyone.

Hi, if I want to run this for a specific retailer do I just change “Total US Households” to “Retailer Households?”
Thanks for the great info
Yes! The Retailer Households measure is the total shoppers at that retailer and then the Penetration would be among their shoppers.
Thanks for the quick response Robin! I’m a little confused with some of the outputs I’m seeing though.
For example, when I pull retailer shoppers for my RMA and dollar sales for my brand, they dollar sales are higher than the tool’s calculation. I’m using inputs from my panel data to fill out the tool (% HH Buying, Purchase Size, and Purchase Frequency). The interesting part is when I switch my geography to Total US, everything seems to fall in line.
Any thoughts? Thanks again
Hmmm…I’ll email you offline to set up a quick call to discuss and hopefully figure out.
This is super helpful, thanks for sharing. Very curious to know how we would approach sizing the prize if we model an increase in penetration instead of an increase in purchase frequency.
Please see this post which addresses that exact question!