 TDP (a.k.a. Total Distribution Points) is my favorite syndicated data measure. Why? Because distribution is fundamental to any business question. Therefore, it’s a great place to start when looking for answers. And TDP is the broadest, most flexible way to examine this crucial dimension.
If you are looking at individual UPCs, you don’t need TDP – it’s the same as % ACV. But any time you’re working above the UPC level, TDP will help you understand the depth and breath of distribution across a group of products. For a group of products, % ACV just addresses breadth (the distribution for at least one product in the group).
In a series of three posts, I’m going to illustrate three ways to use TDP in your analysis: velocity, sales trends and sales productivity. To get the most from these posts, you’ll need to understand the basics of TDP and the concept of velocity.
In this post, I’m going to illustrate my analysis with a fictional yogurt category. Caution: This is fake data! Do not use this in your yogurt business plan! (Actually, it’s real data—but not for yogurt.)
The Most Common Use of TDP: Velocity Denominator
The simplest, most common use of TDP is as a component of velocity. Both Nielsen and IRI (regardless of the form in which you get the data or the tool you use) provide two velocity measures:
- Sales per point of distribution
- Sales per million dollars of ACV.
(If I’ve lost you, allow me to again point you to this velocity primer.)
Conceptually, velocity can be expressed as:
Sales ÷ Distribution
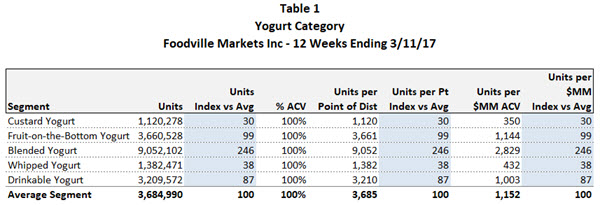
However, if your group of products has distribution of 100% (or close to it), basic velocity measures become meaningless. Allow me to demonstrate:

In the table above, I’ve indexed the values for each segment to the average segment. Indexed Units, indexed Units per Point of Distribution, and indexed Units per $MM ACV are all identical. The two classic velocity measures (Units Per Point and Units Per Million) add nothing to our understanding of the differences across segments. Because % ACV for the group of products is 100%, these measures of velocity provide no more differentiation than total units.
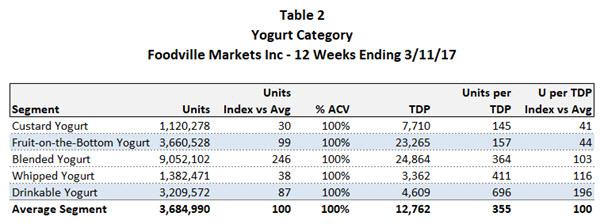
Now, let’s use TDP in our analysis instead of % ACV:

Units per TDP gives a very different picture of the strength of each segment. “Fruit-on-the-Bottom Yogurt” and “Drinkable Yogurt” generate about the same number of units. But Drinkable Yogurt does it with a fraction of the variety (and presumably shelf space since the two generally correlate).
Technical side note: Some databases will have TDP measures. Some will not. If you don’t have TDP measures, you can calculate them. To get TDP, sum item level % ACV and multiply by 100 (because TDP is not a %). Then sum up units for the same group of products. Then manually calculate Units per TDP.
Now suppose you want to compare across markets. You need to factor in retailer/market ACV. Why? Because Units Per Point of TDP will naturally be higher for a large store than a small store.
So how do you work TDP into your Units Per Million number?
I solve this dilemma by multiplying TDP by total market ACV and then use that as the denominator in my velocity calculation. “Total market ACV” means sales across all products, not just the ones you are analyzing. If you are confused by this concept, learn more about ACV here.
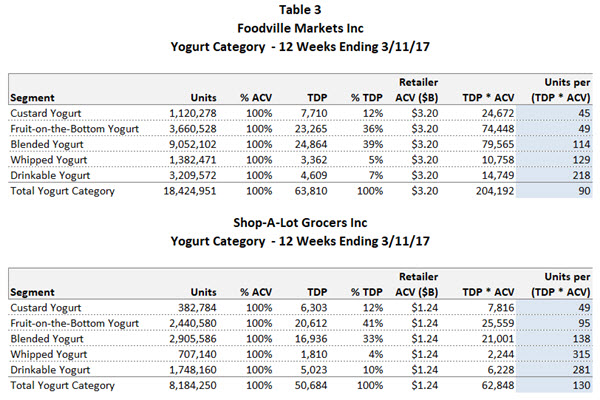
See the table below for an example of this calculation. I’ve run it for two different (pretend) retailers so you can compare the results (shaded in blue).

A couple of notes about this chart:
- You’ll see that my homemade measure doesn’t result in an intuitive number. That’s always a problem with “per million” velocity calculations. In an upcoming post, I’ll give some suggestions for how to make non-intuitive measures more user friendly. But for now, let’s just live with it and look at the relative numbers.
- Some databases will have a measure that is, in some cases, comparable to my homemade measure. In Nielsen Answers it’s called: “Units / $MM ACV / Item”. IRI may have something similar – email me or post a comment if you have the IRI measure name. This measure will be comparable to my measure only if % ACV for the group of products is 100% or close to 100%. Why? I think that’s a whole ‘nother post. For now, take my word for it.
- If you need to calculate my measure, you may also need to calculate Total Market ACV. To do that, pick a product or product group with 100% distribution. Then divide Sales by Sales Per Million. For example, using the first line of the Table 1: 1,120,278 / 350 = $3201 MM. I converted this to billions in Table 3, just to make the numbers tidier ($3.2 billion). You get approximately the same market ACV number no matter which product line you use, if it’s the same market and % ACV = 100%. I’ve written a whole post on this calculation if you want to go through it step by step.
So, what does this table tell us about yogurt? Here’s what I see:
- Retailer ACV: Foodville Markets sells a lot more yogurt than Shop-A-Lot, but Foodville is more than twice the size of Shop-A-Lot, so it had better sell more!
- % ACV: % ACV for the segments is 100% across both retailers (which means they both sell all the segments in all their stores) so we need to go to TDP to understand more about relative segment performance.
- % TDP: TDPs are distributed across segments fairly evenly at the two retailers. There are some differences but they are subtle (we’ll get back to that in a moment).
- Units per (TDP * ACV): When we incorporate TDPs, we see that yogurt velocity is significantly lower at Foodville ($90 vs. $130 for Shop-A-Lot). The segments with the greatest discrepancies are “Fruit-On-The-Bottom” and “Whipped.”
The Fruit-on-the-Bottom differences deserve more scrutiny because that’s the second biggest segment. Going back to those subtle % TDP differences, we see that this value is lower for Foodville, so the retailer may be missing some crucial variety. Or perhaps the price is off. Or the demographics of Shop-A-Lot are better for this segment. At this point, we don’t know for sure.
And this is how you work the analysis. Basically, you generate a bunch of hypotheses and then dive deeper into the segment to see which ones hold. Ultimately, your objective is to come up with recommendations for the retailer.
We can apply the same pattern of thinking to “Whipped Yogurt,” which is also performing poorly. Even though it’s a much smaller segment, it could be very high priority for the manufacturer or the retailer (maybe it’s the high growth segment or has higher margins).
Another hypothesis to investigate is whether Foodville has too much variety in the yogurt category. Given its lower velocity, the solution might be to pull weaker items out of each segment. Ultimately, the decision will depend on the retailer’s goals and how this category compares to others. My sample data provides no definitive answers because we lack context. But regardless, this example illustrates the power of bringing TDP into the analysis.
You can also apply this type of analysis at the brand level or for promoted product groups. Basically, it’s a useful tool in any situation where you have groups of products and want to get a big-picture view of distribution across the entire group.
How do you use TDP? Share your analysis tips and tricks below.
Did you find this article useful? Subscribe to CPG Data Tip Sheet to get future posts delivered to your email in-box. We publish articles about once a month. We will not share your email address with anyone.

Excellent post, as always!
Could Units / $MM ACV / Item and $ / $MM ACV / Item be used as “master” velocity metrics since they can be applied consistently to national and market level data, as well as for brand and UPC level data? Is there a reason not to do so, apart from the fact that they don’t yield as intuitive of a result as Units/TDP or $/TDP? I ask because it would be convenient to use a single velocity measure in a pre-built report and then swap in different markets and products as needed. Thanks in advance for your insight.
I’m glad you asked this. I realize I should have made this clearer in the post and will amend it to reflect my answer to your comment.
Units / $MM ACV / Item is only comparable to a TDP measure when %ACV for the group is 100% or close to it. So you can only use that measure as a substitute for my manual calculation in that case. The “Item” in the denominator is “Average Items Carried”. Average Items Carried is equivalent to TDP whenever % ACV for the product group is 100%.
I think the idea of creating a master velocity metric based on TDP and always using it is a good one though. You can add that custom measure to Answers or whatever tool you are using (be it Nielsen or IRI). The numbers won’t be intuitive, as you say, but neither is Sales per Million. I see no analytical reason not to do that.
Should your units on your ‘Units per (TDP * ACV)’ metric be dollars? If I work out the units for your calculation, it would seem to me you would have units of [units/dollars]. ACV has units of [dollars], TDP has no units as it’s a sum of percentages and is treated in this calculation as a weight. Hence, ‘TDP * ACV’ has units of [dollars] (albeit weighted dollars). As a result, ‘Units per (TDP * ACV)’ should have units of [units/dollars]. If I misunderstood your calculation, could you please explain how you arrive at dollar units?
You are quite right – there should not be a dollar sign in that column. The measure is units so it can’t be dollars. I have edited the table in the post to reflect your correct. Thank you!
Can you explain how units per store per week selling can fit into this context?
We have used units per store per week selling as a velocity metrics to measure our performance. Like to make sure this is comparable to units per $MM ACV per item you are referring to in this blog..
Thanks
Units per store per week is definitely the most intuitive and easy-to-understand velocity metric so is very popular when interacting with retailers. Similar to what Sally says in this post about the value of one distribution being different in different geographies, the same is true of stores. You would expect the same product to have a higher units/store/week in a larger store with more shoppers than in a smaller store. Also units/store/week makes the most sense at the item, as opposed to brand, level. If you use it at an aggregate product level then you need to control for number of items, so measure would be units/store/week/item. Depending on how you are using velocity you may look at different measures. Retailers typically like to see units/store/week at the item level which is fine if you are only showing data for one retailer and its stores are pretty much the same size. Otherwise it’s better to use per $MM ACV measures, especially when calculating the size of distribution opportunities.