This is the fifth in a series of posts on quantifying the impact of business drivers on sales volume. Please review these posts first to get more context:
Part 1 – Overview of this very useful analytical technique that helps answer the question Why did our volume change?
Part 2 – Impact of Distribution
Part 3 – Impact of Pricing
Part 4 – Impact of Trade
And then the final post in the series, when you finish reading this one: Part 6 – Impact of Everything Else
This post focuses on quantifying the impact of Competition. This business driver is probably the one where judgement comes into play the most, since most people will need to make some educated guesses. IMPORTANT: Of all the business drivers, this is the one that relies more on “art” than “science.” You may want to explicitly note for your audience that the amount of volume change attributed to competition should be used with caution.
In this case study, we are explaining the 2.5% volume change for Magnificent Muffins, shown in the first line of the table below. I’ll walk through how to determine what the values are in the last 2 columns of the table based on a change in volume of Magnificent Muffins’ key competitor. I am showing just one competitor but you may want to include more than one, especially if your brand has a relatively low share in the category. You can see that in this example, the annual volume of Competitor X is about 2/3 the size of Magnificent Muffins volume (128MM vs. 187MM). More on this a little later.
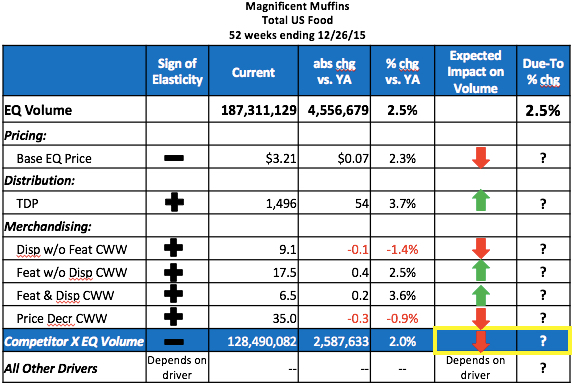
The key concept here is assuming that some portion of the increase in volume for Competitor X came out of Magnificent Muffins. There is usually some interaction between most brands within a category – very few households only ever purchase one brand in category over the course of a whole year. The elasticity for competition is always negative since we would expect our volume to go down when the competitive volume goes up.
Because we are looking backwards and explaining what has already happened, the measure I’ll use for competition is the actual change in volume for Competitor X. That volume change is up +2,587,622 (+2.0%). Here’s the relevant data from the table above:
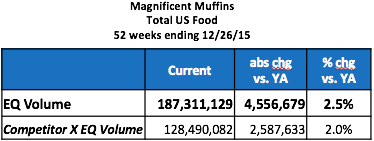
We see that volume sales are up +2.5% for Magnificent Muffins but also up +2.0% for Competitor X. As mentioned above, the expected direction of the sales impact on Magnificent Muffins for an increase in competitive volume, you would expect a decrease. So now the question is: How much did the over 2.5 million pound increase in Competitor X volume come out of Magnificent Muffins volume?
Estimating Competition Elasticity
The best way to know how much of the volume increase for Competitor X came from sales that would have gone to Magnificent Muffins is by conducting a source of volume analysis based on shopper panel data. (See this post for an overview of how panel data is different than scanner or POS data which is what we’re using for the volume decomposition.) Most small- and medium-size companies (and even some large companies) do not have easy access to (or the budget for) a source of volume analysis so here are some things to think about when coming up with your competition elasticity.
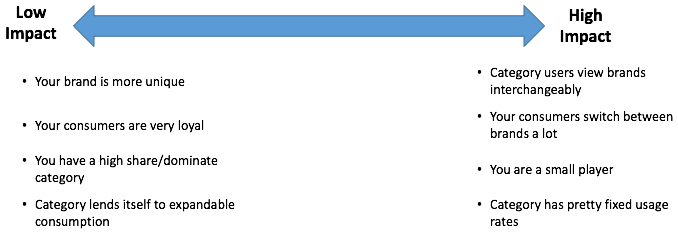
- If your brand is more unique and offers something not available from the competition then you are less likely to be impacted by a change in competitive volume. On the other hand, if consumers view all brands as pretty much the same and interchangeable then an increase in competitive volume is more likely to come from your brand and a decrease in competitive volume is more likely to benefit your brand.
- How loyal your buyers are is related to the previous point. If they are very loyal to you then an increase in competitive volume is less likely to come from your brand. If there is a lot of switching between brands than a gain for the competition is more likely to come from your brand (and other brands).
- One of the advantages to being the biggest player is that you tend to be more insulated from the competition. Unfortunately, if you are a small brand your volume can be highly impacted by a larger competitor’s promotions and/or advertising.
- Lastly, think about what is happening to the overall category volume. If a competitor’s volume is up, is that additional volume more likely to be incremental to the category or come from other brands? The term “expandable consumption” means that if there is more of a product in the house, consumers will use more. Two classic examples at opposite ends of the spectrum here are snack foods and laundry detergent. If there snack foods in the house then people are likely to eat more of them and if they are on sale people buy more. Laundry detergent, however, has a pretty fixed usage rate. You won’t use more just because it’s in the house or on sale. (You may buy more when it’s on sale but then you’ll just postpone a future purchase.) If a category lends itself to expandable consumption then more of a competitor’s volume increase may be growing the category and not stealing from other brands.
In the absence of a source of volume analysis (the best way to do this, mentioned above), we will assume that Magnificent Muffins lost its fair share of volume to Competitor X. (Regular readers of the CPG Data Tip Sheet may remember some previous posts on fair share. You’ll see that the term can be used in various ways – fair share of distribution, fair share gap analysis.)
Fair Share of Volume
We need to come up with a reasonable estimate of how much of the 2,587,633 additional Competitor X volume came out of Magnificent Muffins. It’s obviously something between none of it and all of it! If these were the only 2 brands in the category and the category volume did not increase over this same period, then all of that increase came out of Magnificent Muffins. Of course that scenario is highly unlikely! Let’s see what the overall competitive environment is for the category and between Magnificent Muffins and Competitor X. Here is the situation:
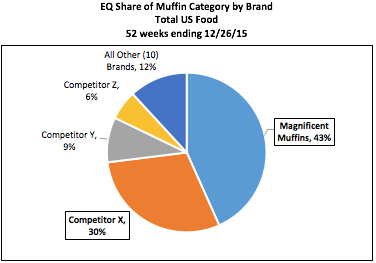
As you can clearly see in the pie chart above, Magnificent Muffins is the leading brand with a volume share of 43%. Competitor X is the #2 player with a 30% share and then Competitors Y and Z have smaller shares than that. In addition, there are 10 other brands that make up the remaining 12% of the category. Based on this competitive situation, Competitor X is really the only one that is likely to have a significant impact on Magnificent Muffins so that’s why it’s the only one included in the volume decomposition.
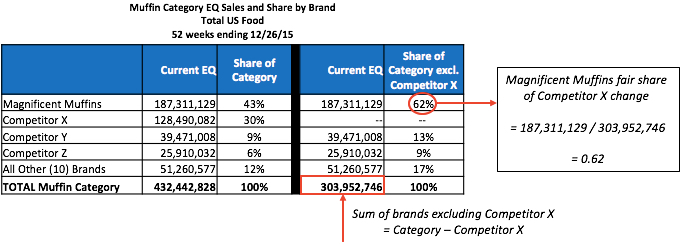
If all brands lose their fair share of volume as Competitor X gains volume, then you need to recalculate everybody’s share taking out Competitor X. Magnificent Muffins’ fair share of Competitor X’s volume gain is 62%. See the calculation below.
Fair share should be the starting point for your competition assumption. Fair share represents the case where:
a. all the competitor’s increase is coming from other brands and none is growing the category OR all the competitor’s decrease is going to other brands and none is just people buying less of the category
b. consumers of the competitive brand think of all the brands as similar to each other and have no preference between the brands.
Once you calculate fair share (as described below), you should then adjust that based on the factors for low/high competitive impact above.
Calculating The Impact of Competitor X Volume Change on Volume
To calculate the impact of Competitor X on volume, follow the numbered steps for that row in the following table:
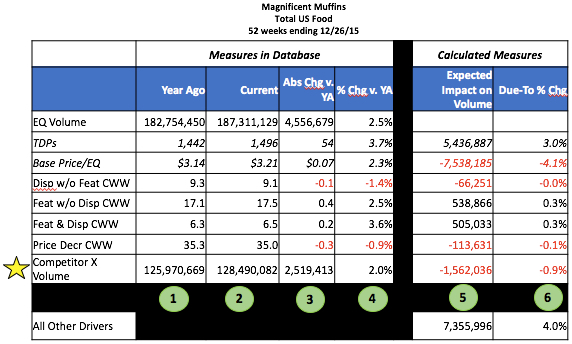
The first 4 data columns are facts that are available in most IRI/Nielsen databases or can be easily calculated from what is available:
- Year ago = value during the same period a year ago
- Current = value in current year
- Abs Chg v. YA = absolute change vs. year ago = Current – Year Ago
- % chg vs. YA = % change vs. year ago = (Current – Year ago) / Year Ago = Abs Chg v. YA / Year Ago
The calculations in the last two columns need to happen in this order:
- 5. Expected Impact on Volume = absolute change in Competitor X EQ volume * Magnificent Muffins fair share * -1 = 2,519,413 * 0.62 * -1 = -1,562,036
- 6. Due-To % Change = Expected Impact / Year Ago EQ Volume for Magnificent Muffins =
-1,562,036 / 182,754,450 = -0.9%. The loss of -0.3 weeks of support resulted in a volume loss of over 100,000 LBS. So a +2.0% increase in Competitor X volume resulted in a -0.9% decline in Magnificent Muffins volume.
The final post in this series will address the remaining row in the table – All Other Drivers, and show a good way to visually summarize the volume decomposition.
Did you find this article useful? Subscribe to CPG Data Tip Sheet to get future posts delivered to your email in-box. We publish articles about once a month. We will not share your email address with anyone.

Great posts!! Thank you for sharing all of these articles. They helped me to analyze the data at different angles and go beyond traditional means. I am eager for the last post of this series so that I can officially complete the Volume Decomposition I have been building since last summer!
Thanks for the kind words, Ryan! I’m glad you have found these posts useful.
Please keep the posts coming! I’ve missed your posts!
I’m having trouble recreating your expected impact to volume in Column 5 for TPR, Base Price, CWW’s. I understand the total expected impact to volume formula, just wondering how you calculated the others.
Take a look at the separate posts about the other drivers you mention that are in the Volume Decomp: Pricing and Merchandising. If you have further questions go ahead and use the Contact Form to ask.
Hi, I was wondering how to add velocity to the bridge.
Is it possible? How could that be done?
Thank you for such useful information!
You can’t really add velocity to this decomposition because then there would be double-counting. Everything except distribution is what drives velocity. You could sum up all the other drivers and call that the volume change due to change in velocity but that is not separate from the other drivers.
Hope that helps!