This is the third in a series of posts on quantifying the impact of business drivers on sales volume. Please review these other posts on this very useful analytical technique that helps answer the question Why did our volume change?
Part 1 – Overview of this very useful analytical technique that helps answer the question Why did our volume change?
Part 2 – Impact of Distribution
Part 4 – Impact of Trade
Part 5 – Impact of Competition
And then the final post in the series, Part 6 – Impact of Everything Else
This post focuses on quantifying the impact of Pricing. There are many different ways to do this but to keep it relatively simple, I’ll be looking at the impact of a change in base price on volume.
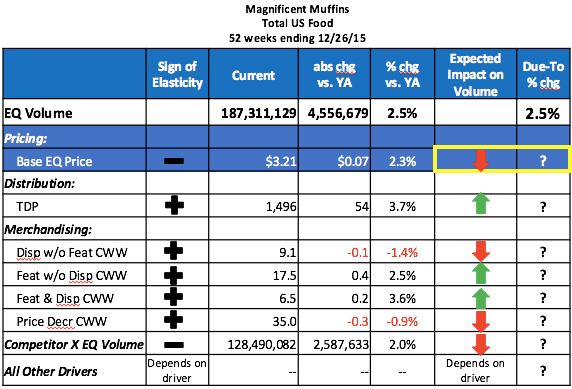
In this case study, we are explaining the 2.5% volume change for Magnificent Muffins, shown in the first line of the table below. I’ll walk through how to determine what the values are in the last 2 columns of the table below based on the change in Price and it’s elasticity. In this previous post I talked about the Distribution driver and in future posts I’ll talk about some of the other drivers. For now we are focusing only on Price, highlighted in blue in the table below.

The measure I’ll use for pricing is base price per EQ. This is the regular or full retail price – what shoppers pay when the product is not on sale. Take a look at this post to refresh your memory on the various pricing measures available. Note that I’m using price per EQ and not price per unit. That’s because this analysis is at the brand level, which aggregates items across different sizes and unit prices. (The impact of promoted price will be taken into account in the next post on merchandising.)
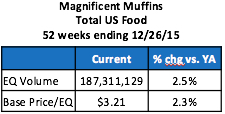
Here’s the relevant data from the table above:

We see that volume sales are up +2.5% and base price is up +2.3%. As with almost all products, if price goes up, you expect volume to go down. Since price has increased (which would make volume decrease), then something else is happening to the business to more than compensate for the impact of the higher pricing. The question is: How much did the 2.3% increase in price drag down volume?
The most common way to do this is to use the price elasticity. Once I have the price elasticity and last year’s volume, I can quantify the impact of the price increase.
Price Elasticity and Price-Promo Study
Many companies that have an on-going contract with IRI or Nielsen have their supplier do a Price-Promo study (short for Price-Promotion). It’s typically paid for out of an “analytics fund” that’s part of the contract. This type of study is usually updated very year or two, to account for changes in the marketplace for the target business and/or its competitors. Even if you don’t have an-ongoing contract, you can still have Nielsen or IRI do this study for you as a standalone project. The key outputs of a Price-Promo study are Base Price Elasticity, Promoted Discount Elasticity, Lift Factors (by merchandising tactic) and Threshold Factors. There is also a simulator available so that you can play “what-if” games to see what the volume, revenue and profit impacts are likely to be with different pricing strategies.
For this exercise, I’ll use the Base Price Elasticity. This number is always negative – if price goes up, volume goes down. It’s usually something between about -2.8 and -0.7. For the vast majority of businesses I’ve seen, it’s between about -2.4 and -1.2. If the price elasticity is -1.0, if price goes up by 5% then volume goes down by 5%. (This is the quick, back-of-the-envelope way to apply price elasticity but is valid for price changes that fall within +/-10% of the original price.)
If a product is “more elastic” it means that it responds more to changes in price and the absolute value of its elasticity is larger. A product with a price elasticity of -1.9 will see a greater change in volume than another product with an elasticity of -1.2, for the same % change in price. In general, products with the following characteristics are more elastic:
- Products less differentiated, commoditized, no secondary benefits
- More competition/substitutes
- More switching, fewer loyal consumers
- Larger size
- Lots of trade promotion – consumers are trained to wait for a lower price
- “Simple luxury” – some consumers trade up if price gets low enough
The best way to get the “real” price elasticity is from a Price-Promo study that you usually get from your data supplier, IRI or Nielsen. (Although it’s possible to calculate an elasticity using information available on your database, I don’t want to endorse doing that since you really need store-level data to get an accurate number. For the rest of this, I’ll assume that you have an elasticity you can use.)
Calculating The Impact of Pricing on Volume
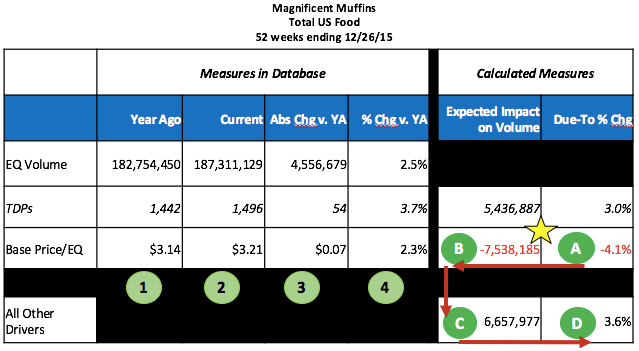
To calculate the impact of pricing on volume, follow the numbered steps in the following table.

The first 4 data columns are facts that are available in most IRI/Nielsen DBs or can be easily calculated from what is available:
- Year ago = value during the same period a year ago
- Current = value in current year
- Abs Chg v. YA = absolute change vs. year ago = Current – Year Ago
- % chg vs. YA = % change vs. year ago = (Current – Year ago) / Year Ago = Abs Chg v. YA / Year Ago
(Note that the row for TDPs was calculated in the last post.) The last 2 columns are “new” measures that I’m calculating and the calculations do happen in this order. In this example, I’ll assume a price elasticity of -1.8.
- Due-to % Chg for Pricing = % chg vs. YA * elasticity = 2.3% * -1.8 = -4.1%. You can say that the base price increase of over 2% resulted in volume going down about 4%, so other drivers must be more than compensating since volume was actually up +2.5%.
- Expected Impact on Volume of Pricing = Due-To % Chg * Year Ago EQ Volume = -4.1% * 182,754,450 = -7,538,185. You can say that the base price increase of +7 cents resulted in a volume loss of more than 7.5 million LBS. Fortunately, other good things (like distribution gains) happened on the brand during this period to more than compensate for the volume loss due to pricing.
- Expected Impact on Volume of All Other Drivers = Abs Chg in Volume – Expected Impact on Volume of Known Drivers so far. This bucket will change as you add more drivers to the due-to. At this point, All Other Drivers means everything else except Distribution and Pricing. The calculation is 4,556,679 – 5,436,887 – (-7,538,185) = 6,657,977. Once we take into account pricing, the total impact of all the other drivers has to be a pretty big positive number.
- Due-to % Chg for All Other Drivers = Expected Impact on Volume of All Other Drivers / Year Ago EQ Volume = 6,657,977 / 182,754,450 = 3.6%. Notice that the sum of the Due-To % Chg measures for Distribution, Pricing and All Other Drivers is the same as the % Chg vs. YA for EQ Volume (3.0% – 4.1% + 3.6% = 2.5%).
So to summarize…in this example, I am estimating that a 3.7% increase in distribution was responsible for a 3.0% increase in volume but a 2.3% base price increase resulted in a -4.1% volume decline. Said another way, if nothing else changed besides pricing, Magnificent Muffin volume would have been down over -4%. Now that we have the impacts of distribution and pricing, the All Other bucket, including everything BUT those 2 drivers, had a large positive impact on volume. In future posts, I’ll pull some more drivers out of the All Other bucket to shed more light on what might be helping volume. Future posts will add more drivers to the analysis (merchandising and competition) but there will almost always be an All Other bucket, since we do not have data for all possible business drivers.
Did you find this article useful? Subscribe to CPG Data Tip Sheet to get future posts delivered to your email in-box. We publish articles about once a month. We will not share your email address with anyone.

Hi, great article as usual. Quick question – in the previous articles in the same series the snapshot was using Avg. Eq Price and in this article you are using Base Eq. Price. Could you explain why you went in a different direction?
Also, is Base eq. price the same as using Non promo price or do you recommend using base eq. 750 ml price (assuming those are your options)?
Boy, nothing gets past some of our eagle-eyed readers! Once I wrote the pricing piece for this (part 3), I realized it would make more sense to use base (rather than average) price but did not go back and update the graphics in parts 1 and 2. I have now done that in parts 1 and 2. I decided to use base price because average price also includes promotions and promoted volume will be handled separately in the next post in the series.
Base price is not the same non-promoted price. See this post that Sally wrote:
https://www.cpgdatainsights.com/pricing-and-promotion/never-look-at-non-promoted-price/
Hope that helps!
Did I miss the part where you explained the calculations behind the Expected Impact on Volume (which totals 5,436,887, or 3.0%)? I find that if I average the TDP +3.7% with the +2.3% Base Price/EQ it is +3.0%. BUT, I’m not positive that is the correct process.
This post specifically focuses on the volume impact of the 2.3% increase in Base Price. Please see this previous post which explains how I calculated the +3.0% (+5,436,887) expected volume impact of the 3.7% increase in Distribution:
https://www.cpgdatainsights.com/distribution/volume-decomposition-part-2-impact-of-distribution/
Hope that helps!
Thank you for your extremely helpful blog! In this example, you used Base Price Elasticity. I think the Promoted Price Elasticity is an important consideration during times when the item is heavily promoted. How would you recommend incorporating Promoted Price Elasticity into the volume decomposition? Ideally, I would be able to use both Everyday and Promoted Price Elasticities, where applicable, in my volume decomposition. Thank you in advance for your suggestions!
We’re glad that you are finding the blog so useful! I will be doing another post about incorporating trade promotion into the volume decomp and promoted price is one of the elements that impacts promoted volume. Anytime you get into trade promotion things start to get complex very quickly! In order to keep things somewhat simpler, I will not be using promoted price elasticity explicitly. If you want to discuss this further, please use the Contact Us form and Id be happy to set up a quick 30-minute call.
Thank you for your blog. I’m using the IRI Academic data set for this pricing analysis in yogurt. The base price is not provided so can I calculate the base price for academic purposes by filtering out all the promoted prices, features, and displays, and use that as the “Base EQ Price” used in your method? Second, the elasticity also is not provided so I thought I could calculate the ratio of percent change in base sales to percent change in base price. Unless there is a known base price elasticity for the yogurt category (2012 data)? Thanks again.
If you are doing this at the retailer level in one market then you can remove promoted weeks and use non-promoted weeks to see base price. (See this post, though, on why this is not always a good thing to do: https://www.cpgdatainsights.com/pricing-and-promotion/never-look-at-non-promoted-price/.
Unfortunately there’s no public source for getting price elasticities and the yogurt category has changed so much (growth of Greek yogurt segment and brands) since 2012 that any current elasticities may not be valid for that period. You could get a decent estimate by looking at % change in base volume divided by % change in base price but do that for a couple years worth of weekly or monthly data if you have that. The calculation should remain fairly consistent over time.
Thanks for the useful articles.
I have one alternative view about the price elasticity, CPI inflation.
If the price elasticity you have observed are always between -2.4 and -1.2, then with the positive inflation rate announced every year would mean that all retailers sell less and less volume.
However, all retail market always reports the positive volume gain every year.
How can we explain this contradiction?
You are correct that retail prices tend to increase over time due to inflation (although that has been negligible in the US for the last few years). It is not necessarily the case that all retail markets report positive volume gains very year. While dollar sales (revenue) often increase, it is quite possible for volume to decline, especially for a single category or brand. Good to see some of our readers really thinking about this stuff!
Hi,
Ca you please help me with price elasticity,if i need to calculate it on my own(here you have assumed it to be -1.8) then can I perform a linear regression on variables like volume=price+promo+distribution??
or I need to use some other analytic technique?
Sorry, but it’s too complicated to explain how to calculate a price elasticity here in the comments. If you do a regression and take the natural log (ln) of volume, price, distribution, etc., then the coefficient on the price variable is interpreted as the price elasticity. If you want to know more, go ahead and email us through the Contact Us link here on the blog.
Hello, I’m an insights intern and what you’re showing is really useful, thank you very much, I was wondering if I wanted to do a value decomposition rather than volume, what would change? I see that Nielsen uses TDP Wghtd Dist, Units / TDP Wghtd Dist, EQ price but I havn’t seen someone talk about it in value decomposition and I was wondering if you could help me 😀
You can do a decomposition on value instead of volume. That is usually done when the key question is how much of the dollar sales have change is due to changing prices vs. changes in true demand for the physical product (volume). So in the table the first row would be value sales (dollars in the US), next row would be Avg Price, the Volume, then Distribution and Velocity. Pricing, Merchandising, Competition and All Other contribute to Velocity but when doing the decomp for Value people are typically most concerned with the impact of Pricing, Distribution and Velocity (and less so on the other drivers). Hope that helps!