This is the sixth and final post in my series on quantifying the impact of business drivers on sales volume.
The first post in the series explains more about when you would want to do an analysis like this. A volume decomposition analysis allows you to explain why your volume changed by allocating the total change in volume to changes in key business drivers. There are 4 posts that explain how to analyze the impact of changes in distribution, pricing, trade promotions and competition. Those are the 4 drivers that are readily available in your IRI/Nielsen database.
This post focuses on how to calculate the portion of volume change due to everything else, besides those 4 drivers and also wraps up the 6-part series. In this example I’ll essentially back into the magnitude of the total of all the other drivers not already accounted for. Although it is possible for some of the “all other” drivers to obtain data outside of IRI/Nielsen and estimate an elasticity, I won’t calculate the volume impact of each of the “all other” drivers individually in this post.
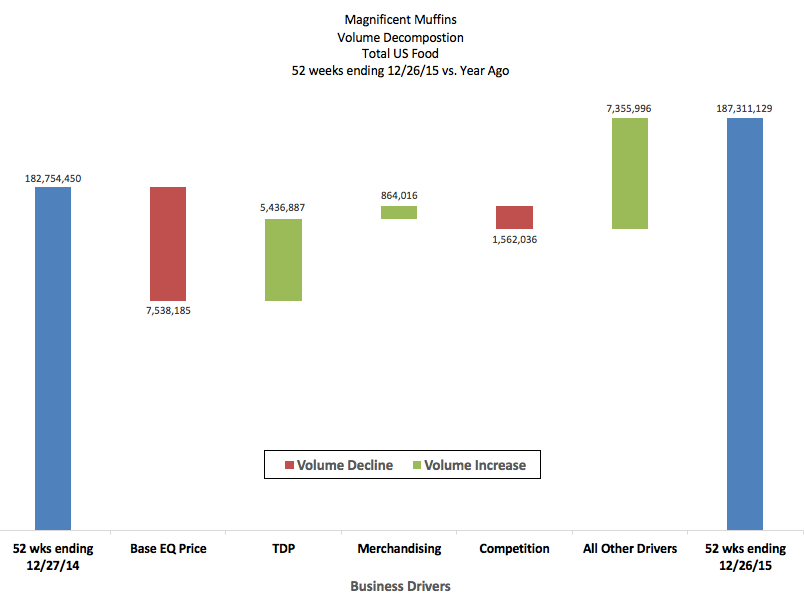
As a reminder, volume for Magnificent Muffins increased by +2.5% or 4,556,679 pounds for the year ending in December 2015 vs. the same period in the previous year. (Pounds is the equivalized unit, or EQ, for this category.) So we are trying to explain that change by allocating the appropriate amounts to various business drivers. The 4 posts mentioned above show how to calculate the expected absolute volume impact of each driver and also how much of the +2.5% increase is due to each driver.
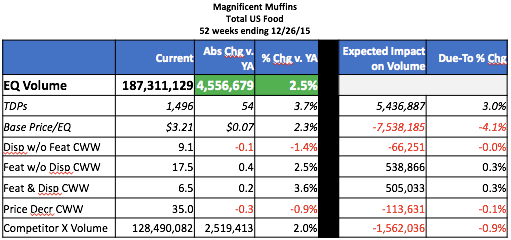
The sum of the expected volume impact from all drivers must be equal to the total change in volume. In this case, the sum of the drivers we’ve analyzed is just under -2.8 million pounds:
5,436,887 – 7,538,185 – 66,251 + 538,866 + 505,033 – 113,631 – 1,562,036 = -2,799,317
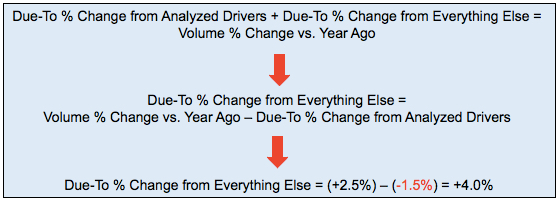
So, if the total volume change is +4,556,679 and the impact of the drivers we’ve already analyzed then other things that happened had to account for +7,355,996:

And you can calculate the Due-To % Change for All Other Drivers in a similar way. The sum of the Due-To % Chg numbers must be equal to the % Change vs. Year Ago for volume, in this case +2.5%. The sum of the Due-To % Change for the analyzed drivers is -1.5% (= +3.0% – 4.1% – 0.0% + 0.3% + 0.3% – 0.1% – 0.9%).
So our completed volume decomposition looks like this:
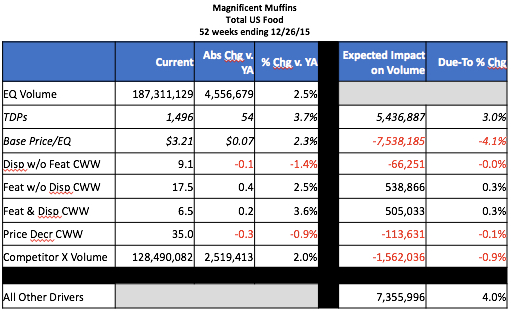
OK, so maybe this was not the best example to use since the % change due-to All Other Drivers (sometimes called the “Unexplained”) is bigger than the total % change in volume (+4.0% vs. 2.5%)! But this is real and gives me an opportunity to talk about what might all those other drivers be (or not be). The chart below summarizes many of the other things that cause volume to change but are not accounted for by facts available in your IRI/Nielsen database.
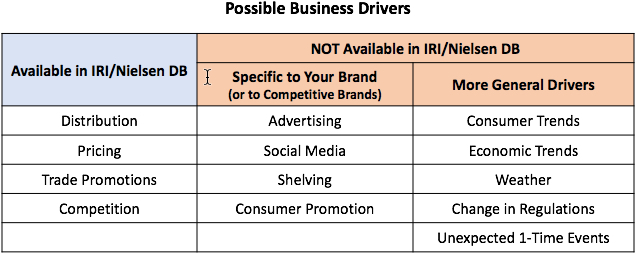
Some of these other drivers are specific to your brand or to competitors and others are more general in nature and affect categories and brands across the store and possibly across the entire economy. Advertising can be more traditional media like TV, radio, print, out-of-home but also includes digital. Social media (Facebook, Instagram, Pinterest, online reviews, etc.) has become very important for many brands. Shelving measures like linear feet, shelf location and facings are typically not available in regular IRI/Nielsen databases. Consumer promotion and many shopper marketing programs also drive volume. These include things like FSIs, instant coupon machines, digital coupons, in-store sampling, etc. Examples of consumer trends are an increased desire for convenience or increased popularity of gluten-free items. Economic variables like disposable income or inflation can often impact spending on entire categories while unusually hot or cold weather can increase or decrease your sales, depending on the seasonality of your product. When there was a change in the legal drinking age in some states, sales of beer and wine adjusted accordingly. An unexpected one-time event (like a black-out, general transportation strike, bad crop year, etc.) can impact many industries.
For Magnificent Muffins, the 4% volume increase from All Other drivers was due to a combination of: more/better advertising, introducing a Facebook page, a very successful sampling program. They also benefitted from a competitor having supply problems for a few months during the year, which I chose not to include in the Competition example for simplicity reasons.
And just to tie this all together visually, here is a waterfall chart which is often used to display the results of a volume decomposition:
Did you find this article useful? Subscribe to CPG Data Tip Sheet to get future posts delivered to your email in-box. We publish articles about once a month. We will not share your email address with anyone.

Thank you so much for these detailed posts! I’m trying to take all of this information and apply it to our business. I had a couple of questions as I started looking through this…
1. Is there a good way to account not only for promoted CWWs, but level of discount during promotion? The way you’ve outlined includes looking at base price, but what about promoted price? I’m in a highly commoditized business where deeper discounts move a lot more product! Maybe looking at average Promo Price (any promo) alongside Base Price?
2. I’m also wondering about factoring in category trends. For example, one category we do business in has been trending down double digits for the past decade as consumers shift to other newer — stores are shrinking sets and all brands are losing business due to consumer shift. Would it make sense to factor in overall category trend to brand performance?
I greatly appreciate your insights. Great posts!
Glad to see you are using the volume decomp methodology on your own business!
1. In order to keep it somewhat simple, I just addressed the quantity of merchandising as measured by CWW and not the quality of the support. The promoted price (or more precisely the promoted discount) would also impact volume and in the example is pat of the Unexplained. As part of the effort to simplify this example, I looked at change in total volume. You could also look at the change in base and incremental volume separately and associate the changes with the drivers that impact base and incremental volume. In that case, you could allocate the change in incremental volume (which by definition is driven by trade merchandising) to quantity vs. quality of support. Calculation for quantity of support is the same as in this example and then I usually look at the change in incremental EQ per CWW of support as a measure of quality of support. That does not explicitly include promoted price or discount but those are the key drivers of incremental velocity changes.
2. Good question about incorporating something for a growing or declining consumer trend for the entire category! Again, I did not do that here so it would be part of the Unexplained. A good rule of thumb is to apply half of whatever the category trend is to any given brand. For example, if the category is down -8%, then assume -4% for your brand. The underlying assumption is that half of the category trend is driven by whatever manufacturers are doing while the other half is the true consumer trend.
Hope these help! If you want to discuss further, please fill out the Contact Us form and I’d be happy to schedule a call.
You can do a few more things with this analysis further:
1. You can extend this volume decomposition and due-tos thought process to a weekly basis, as well as to specific sales channels or geographical markets. I have typically found that this gives an approximate but direction assessment of the impact of large volume impact of price promotions, etc.
2. You can calculate a ratio of EQ Vol for your brands to the category on 4 week moving average basis. You can then estimate a trend in this ratio over time, A simple way would be to simply so a scatter plot of this ratio with time. This way you can identify of the category dynamics are in line with your brand dynamics.
Yes, you can definitely do this analysis at any level of geography. Although you can do it on a weekly basis, I’m not sure it’s worth the time and effort unless you have it pretty much automated. You can see what drove volume in a given week but I’m not sure how you would react to that/change tactics on a weekly basis.
For your 2nd point…I think you are saying to look at your brand’s share (brand EQ/category EQ) trended over time. That does show if your brand is keeping up with the category.
Hi Robin!
I have been using this analysis on some brands that I represent, but I just ran into an issue today and was wondering if you could help me sort it out.
Knowing we are basing everything off of EQ Volume, there have been some slight differences in $ and U trends vs EQ trends. SO my question is does an EQ Volume Due-To % Chg hold true to $ and U trends?
Ex. 1) Base Price per U for a Brand X grew +$2.56 but Base Volume Price per EQ declined -$1.96 – this because a SKU of .49oz was removed from a brand that mostly has items in the 4oz-12oz range. So now consumers are buying more per EQ Volume. Overall dollars and units declined, and I can’t help but think it had to do something with the base price per unit increase, but since because Base Price per EQ went down, it is showing that it positively affected Brand X’s Volume per EQ.
Ex. 2) Brand Y (a competitor of Brand X) grew in $ and U but EQ Volume went down. I assume this may have something to do with a pack size change? Since Brand Y’s volume declined, it shows that it positively affected Brand X’s volume – even though one would think that if Brand Y’s $ and U sales grew it would negatively affect Brand X’s sales.
So to reiterate. Are these numbers only directional for volume, or do these changes in volume really cut down to what is happening to Brand X at the $/U level and it’s showing that price and competition really weren’t the determining factors for it’s overall decline?
Thank you! Hopefully I was clear – it’s a bit difficult to explain and ask!!
You have hit upon a common analysis issue that occurs when a brand changes the package size! 98% of the time a manufacturer will make a package smaller, as opposed to larger. This is a common alternative to raising the unit price, which is more obvious to shoppers. The consumer pays the same unit price for a slightly smaller package, which translates into a higher price per EQ price. And that definitely throws off the impact of price when doing a volume decomp on equivalized and not unit volume. I recommend having to rows in the volume decomp for pricing: one for the change in price and another for the downsizing. That is a good topic for a future post but I can give you more info if you fill out the Contact Us form on the blog.
Fantastic learning through a case study, Robin. Thank you very much for taking the effort to write this 6 part series.
Wanted to bring to your attention that “Subscribe to CPG Data Tip Sheet” link is not working. I wasn’t able to subscribe to receive your posts via email. You may want to check this link (in all 6 posts). However, I was able to subscribe when I wrote a comment, via the option available in the comment form.
Thanks for the heads-up, Neerav! The Subscribe links should now work in all 6 posts in this series. Maybe too much information, but…we changed the subscription service about 6 months ago and are slowly updating the links in all the posts on the blog. It’s good to know that people do read things carefully and that we continue to get subscribers. Thanks again.
Hello! I love all of these posts and reference them regularly. I was wondering if you could provide some input on calculating seasonality. Is there a standard methodology you’d recommend? I’ve looked at unit sales by week for 52 weeks to understand performance versus average and I’ve also looked at index of brand to category. Does it matter if you look at base unit sales versus total unit sales? Any input you could provide would be much appreciated!
I would look at base sales, since that is at least factoring out promotion. But remember that there are lots of other things besides seasonality impacting base sales trends. For example, sometimes retailers will beef up the planogram for a category during the high season. So part of the base sales ramp up is due to real seasonality but some is due to increased distribution and it can be tough to separate the two. Or you may do all your advertising during the high season. So that additional marketing is reflected in stronger base sales and it’s 100% correlated with the underlying seasonality. Therefore, unless you have sophisticated modelling that somehow can factor out all those various pieces, only part of what you call “seasonality” may be true seasonality. Hope that makes sense.
I would look at category or sub-category, rather than brand, if I’m trying to explain it as something related to general consumer demand driven by time of year (rather than something marketing driven by me or another brand).
The exception to looking at base sales might be in a category that is super seasonal, like some candy sub-categories, where specific weeks spike wildly and every stores is promoting. Base sales may not full reflect underlying seasonality in those cases.