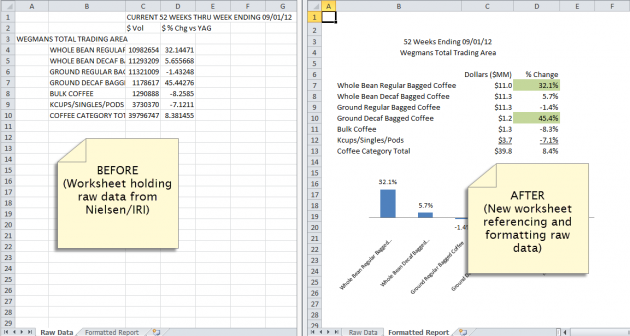
Did you check out my post about automating reports in Excel? I showed the right way to set up reports (so you won’t have to reformat when you get new data). Now I want to share more about two handy Excel functions: RIGHT and PROPER. I used these for the retailer name, date and product titles in my example report.
PROPER is really simple. It converts text into upper and lower case, which I think is easier to read than the ALL CAPS that are sometimes used in the Nielsen and IRI databases. I used this to clean up the retailer name and the product category names in my example.
I could have used PROPER for the date as well but I also thought the IRI/Nielsen header was too long. So I took a slightly fancier approach.
First, I pulled out the actual date with RIGHT since that will change every month. You just need to tell Excel what cell has the text and how many characters you want to reference.
Then I joined the date with my own text using Excel’s concatenation symbol which is & (aka the ampersand).
In the picture below, you can see exactly how to specify the formulas. Cell B2 contains the time period text from my raw data file (as it might appear directly from IRI or Nielsen). Line 6 reformats that time period using PROPER, Line 8 is an example using RIGHT, and Line 10 puts it all together. Click on the image for a larger version.

Now go try RIGHT and PROPER in one of your reports! If you would like a copy of the spreadsheet I used to create the report automation example, email me and I’ll be happy to send it to you.
What Excel functions save you the most time? Share your suggestions in the comments below.

VLOOKUP,Index Match,Indirect,Sumif,Sumifs,Countif
Hey there!
I have gone through various article of yours.. and they are simply superb.
I use your posts to gain knowledge and apply it in a project that I am currently working on. Thanks much!
I am wondering if you have a framework for a set of executive level reports to help them view and analyze business performance. For example, if one is a category manager for foods section at Pepsi for US- what information she should like to see through a series of reports / dashboards. And then if one is brand manager for Lays, what info would this person like. Marketshare, % change (52 weeks, 12 weeks), sales, turnover, profit, across geopraphy/brands/sales channel etc….
Curious to know if there is a sample set of reports available. I am trying to create one for my clients (category managers and brand managers).
Thanks,
Nitin
Hi Nitin,
I’m glad you’ve found the blog helpful!
We don’t have any sample reports. If you are an IRI or Nielsen client, they may be able to provide some framework reports to get you started. Both of them have analytic roadmaps available in their newer web portals (Nielsen Answers and IRI Advantage). I think there is much less available if you are on the older, legacy systems (Nielsen Nitro and IRI Xelerate).
You are right to be thinking about different reports for different internal clients, since the types of decisions they make will be quite different.
Your starting list below is a good one. Your marketing person would probably need a more geographical perspective and your category manager might be more focused on accounts than geographies. In addition to the competitive perspective provided by market share, you will probably also want to include sales and trends for key competitors. Your clients may also need to know about sub-segments of the category, new versus existing products, distribution and price trends (since those are key sales drivers).
With this type of exercise, it’s hard to find the right balance in term of quantity of information. The level of detail can be tough to nail and often a few iterations are needed. Data users will often request more and more information that they *might* need to know and then your reports/dashboards get too complicated and cumbersome. Continuing to probe regarding what decisions they will make from the data can be helpful in keeping the quantity under control.
Best of luck with your project!