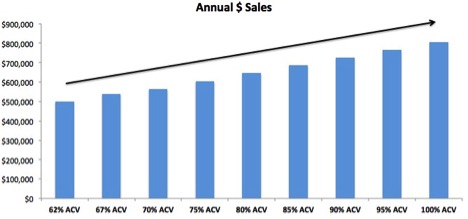
In this previous post I explained how to quantify the size of the opportunity for both your brand and the category if you are getting less than your fair share of distribution. This time I will show how to quantify the impact of getting your brand into more stores, regardless of your current share of distribution. Before continuing, you may want to review this information on %ACV Distribution.
Let’s use the following data for this example:

Brilliant Brand currently has annual sales of $500,000 in retailer Fantastic Foods. But…they are only in 62% distribution. We will calculate how much more Brilliant Brand could sell in Fantastic Foods for each additional point of distribution they can get. That way we’ll be able to answer “how much more would be sold if the brand were in 70% distribution? 75%? 80? etc.” Although Brilliant Brand would like to be in 100% distribution, it may not be realistic to get into every store so knowing how much they get for each point of distribution allows us to quantify the opportunity of getting any additional point of distribution.
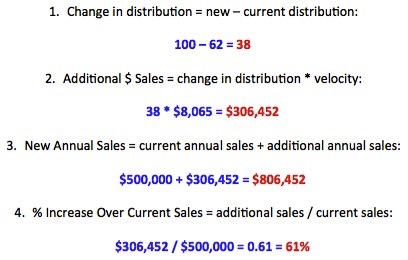
They key to this analysis is to calculate the velocity (or pull it directly from the database if it is available there). Velocity tells you how well your product sells when it’s available to consumers on the shelf. Read more about the measure here. For this analysis we will use $ sales per point if distribution (often abbreviated as “$ SPPD”) as the velocity measure. In our example $ SPPD is $8,065, calculated as follows:
$ SPPD velocity = $ Sales / %ACV Distribution, so
$500,000 / 62 = $8,065
For every point of ACV distribution at Fantastic Foods, Brilliant Brand sells $8,065. (Note: On average, you can assume that the brand will sell that same amount for each additional point of distribution. If the distribution is already quite high – maybe 80% ACV or higher – you may want to use a somewhat lower velocity. “Better” stores often take products earlier so the stores added later have lower velocity.)
Now we can use that velocity to understand the size of the opportunity as the brand reaches different levels of distribution.

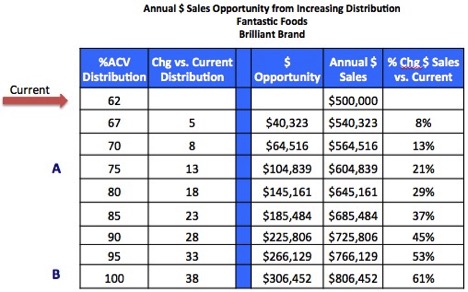
Looking at row A in the table above, the brand reaches 75% ACV Distribution. This is an increase of 13 points above the current distribution (75 – 62 = 13). An extra 13 points of distribution is worth almost $105,000 annually (13 * $8,065 = $104,839). And that is 21% higher than the current annual sales ($104,839 / $500,000 = 0.21 = 21%).
If Brilliant Brand can get to full distribution of 100% at Fantastic Foods (row B in the table above), the opportunity is over $300,000, a 61% increase over current annual sales. The improved annual sales are $806,452.

Now you can quantify the sales you are missing if your products are not in full distribution, either at the brand or item level and at a specific retail customer or across any channel or market. This analysis works for any product and any geography available in your database. Of course you’ll need to convince the retailers that our brand deserves to be in more stores and that can be done by showing them you’re your velocity is [hopefully] higher than the competition.
Did you find this article useful? Subscribe to CPG Data Tip Sheet to get future posts delivered to your email in-box. We publish articles about once a month. We will not share your email address with anyone.

When calculating the point of distribution worth, can this be done at UPC level?
Yes, you can do this calculation at the UPC level. You just need to make sure that you are matching UPC level distribution and UPC level velocity to calculate the opportunity.
UPC Sales per Point of Distribution = (UPC Sales/UPC Current Distribution)
UPC Opportunity = UPC Sales per Point of Distribution * Expected Increase in UPC Distribution
Hi. Is there an excel file example that will calculate the UPC Opportunity based on $ sales acv/million ?
Please click here to see an XLS file that allows you to enter various levels of distribution growth and see the resulting sales. Make sure to DOWNLOAD the file before making any changes to it! Enter things in the yellow-shaded cells, all other cells are formulas.
You’ll see 2 different tables – one for using $/Pt ACV velocity metric and the other for $/$MM ACV velocity metric. Notice that the results are the same because both hinge on the velocity remaining the same regardless of how much distribution changes.
Please let me know if you have any further questions.
Hi Robin, Again.. insightful article. We often hear various terms to measure the “performance” of a brand such as Turns, Velocity, SPPD, SPTPD (Sales per Total Points of Distbn), Sales Rate / Rate of Sales, Sales per store per week, No. of Days (for total retail sell out), etc., Could you please provide your views on usage preferences and other watch outs these measures? Thanks
Almost all the terms you reference are various ways to measure the velocity (or sales rate or ROS/rate of sales) of a product. These measures control for different levels of distribution so you can fairly compare performance across products. Retailers like to look at sales per store per week while manufacturers usually look at sales per something to do with ACV. The only term that is not a velocity measure is No. of Days (sometimes called Days of Supply). That is a measure of retail inventory – how many days of daily typical sales are on-hand either on-shelf or in the back room of a store.
Take a look at this post from the blog all about velocity:
Hi, If I am basing off the velocity on a 13 week period, I should be multiplying the opportunity $ *4 to project an annual number correct?
Yes! It’s best to show a retailer the annual opportunity so you do need to multiply the result from a 13-week calculation x 4 to get an annual opportunity number.
Hi! I am looking for an example to help me better understand examining SSPD for a particular brand by retailer. Do you have an example of this application?
You can do the analysis in this post at the retailer level for a brand. If you want to compare the velocity of a brand between different retailers, though, do NOT use the measure SPPD. This is because a point of distribution in one retailer is not same as a point of distribution in another. To compare velocity across retailers you should use sales per $MM ACV. Let me know if you want more information on that.
Hello, how do I then do this same opportunity analysis using $MM ACV?
Because the opportunity question here is based on % ACV Distribution, it wouldn’t make sense to be using the $MM ACV velocity measure in the calculation. We are asking “how much is one more point of distribution worth” so we want to use a velocity measure that is based on points of distribution.
If you were asked a question like “how much would we get in additional sales if we got distribution in another $500 million of ACV”, then you would use $MM ACV as the velocity measure in Robin’s calculation. Let’s say your product averaged velocity of $400 $/MM annually. $400 multiplied by that $500 million increase = $200,000 increase in sales. You could create a table with various assumptions for different levels of distribution increases just like Robin did for the % ACV Distribution.
Hi Robin — I’m trying to calculate the Size of Prize based on Penetration or % of Households buying. If I can increase penetration by 1%, what would that equal in sales? Thanks
We will be doing some posts in 2019 on specific calculations for size of the prize for different panel measures. In the meantime, I’ll email you something that I have that explains what you asked.
This is really helpful, can you also please recommend what would ideally go into determining the cost of achieving a single distribution point.
This is tough to answer, as it differs by many factors: specific retailer, category, brand/manufacturer’s size/position in the category. if your items are truly performing better than other items that your recommend a swap for then the cost should not be too high in terms of actual dollars paid (for slotting, for example).
Hi,
So my question, How do you calculate the potential dollar sales of a UPC in a retailer that does not currently carry the item? Do you use $/MM ACV in the ROM? or Multiply the Retailers share of the market by the UPC’s DSPPD or $/MM ACV in the ROM?
I would use $/MM ACV in the ROM. However, you might want to use judgement to adjust that number when you use it. For example, if you know the target retailer typically has stronger velocity than the ROM, you could bump up your estimate. Or vice versa. You could figure this out by comparing $/MM for items carried by both the target retailer and the ROM to understand how you might want to adjust assumptions for an item not carried by the target retailer. Hope this helps!
Hi. I enjoy all the CPG Data Tip Sheets.
Am I able to calculate the value of a specific market share point? My struggle is I am sharing all brands to the specific market so there would be no share change per said market. Thank you.
To calculate the value of a share point, take the total dollar sales for the market and divide by 100. Hope this helps!