A common question that arises, especially when your company is new to syndicated retail sales scanner data, is “how come IRI/Nielsen sales data is different than our own shipment data?” This probably comes up most often in the context of forecasting, when you are trying to determine if you are going to “make the numbers” for the current period or for the year or even for a particular important holiday promotion. This can be done at different geography levels: from an entire national channel down to one specific retail customer. Of course you would not expect shipments and retail sales to be the same in any single week, but over some longer timeframe, they should be pretty much the same unless one of the factors listed below is having a big impact.
Here are 4 reasons why you will see differences between how much your company is shipping and how much is selling at retail. (Notice how these conveniently line up with the 4 dimensions of a database!)
- It takes time for products to move through the supply chain between the manufacturer and the shoppers who ultimately purchase. The longer the time period, the closer shipments and retail sales will be. Remember that your shipments need to get to the retailer warehouses and then to their stores before a shopper can buy. This issue will be especially noticeable for new products, as retailers fill their pipelines in the warehouse, back rooms and at shelf. Keep in mind that if you have a DSD (direct store delivery) business, this issue will be minimal.
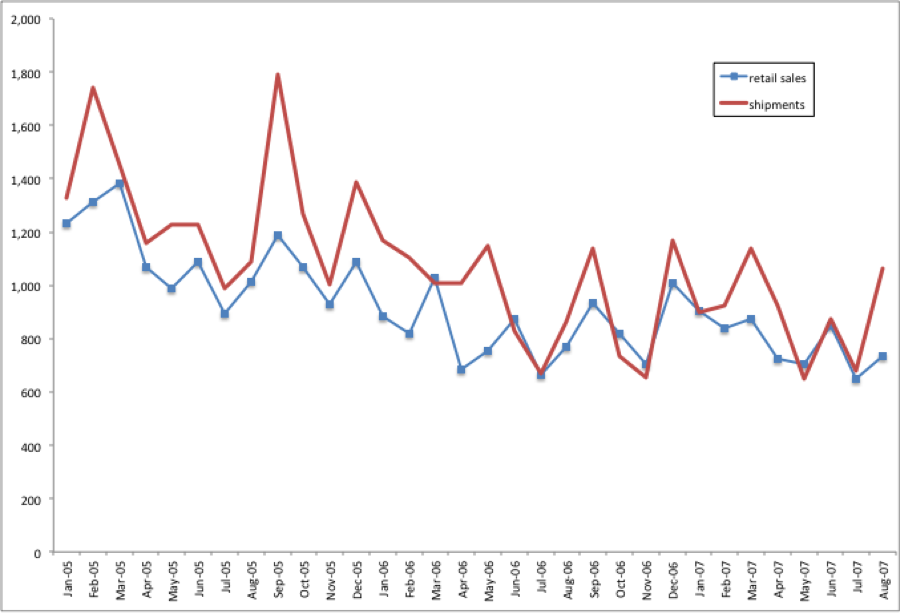
- Although IRI and Nielsen are very comprehensive in terms of the geographies they cover, you might ship to channels and/or retailers that they don’t cover or project to. (See this post for a refresher on what is covered.) For example, the following are NOT covered by IRI/Nielsen: Natural food stores (“health food” stores), Specialty Gourmet food stores, smaller Grocery stores (with under $2MM ACV), office supply stores, hardware/home improvement stores, online sales, Costco, Dollar Tree. Before you compare shipments to scanner data, make sure the geographies line up as closely as possible. Sometimes you’ll have to aggregate up from the retail customer level to get shipments that are comparable to the sales you get from IRI or Nielsen. Are you looking at Grocery only? Is Walmart included? What about Club stores or Convenience stores? Shipments and retail sales for a single retail customer should be very close, especially over a long time period.Even for channels that are covered, it is not always at 100%. In that case, then you’ll need to calculate a coverage factor that can be applied to the retail sales data to make it line up with your shipments. A coverage factor is usually in the 95-99% range. Take a look at the graph below. You can see that even if we add up sales over 2 years, the shipments (in red) will be higher than the retail sales from IRI/Nielsen.
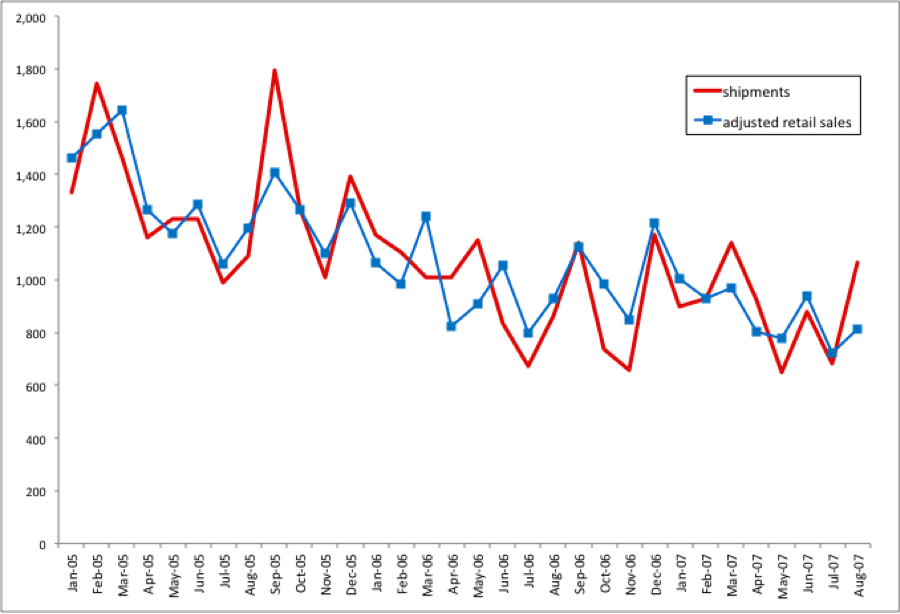
 Once we apply an appropriate coverage factor, you can see that the shipments and retail sales align more closely over time.
 I’ll explain how to calculate a coverage factor in a future post. Keep in mind that shipments and retail sales for a single retail customer should be very close, especially over a long time period.
 - Check the product definition of the retail sales data that you have from IRI or Nielsen – what exactly is included in the data that you bought? Take a look at this previous post on category definitions. If you have an on-going database, then a lot of effort hopefully went into the discussions prior to getting the data from IRI or Nielsen. If you just have a single report from them, then this could be big issue.
- Check the units of measure being used. Shipments are often expressed in cases, while scanner data can be in units or equivalized units. If the shipments and scanner sales differ by orders of magnitude (rather than by a few percentage points), then check this first! You may need to use a conversion factor to get everything into the same unit of measure, usually whatever the shipments are in.
Once you understand exactly which products and geography are covered by the scanner data (and in what unit of measure), you can then match up your shipments for those same dimensions, apply coverage and conversion factors if necessary and add a time lag to see the true relationship.
Have other questions about shipments vs. retail sales data? Did you find this article useful? Subscribe to CPG Data Tip Sheet to get future posts delivered to your email in-box. We publish articles twice a month. We will not share your email address with anyone.

Thank you for providing insight into your experience. What a great site! I’m an independent retail broker/rep that is mainly concentrated in hardware/DIY. We are heavy CPG in our portfolio and I’m wondering if this channel has ANY reported data that your aware of? What sells in Ace or Menards is VERY different than CVS, Albertsons, etc… We’re asked constantly for data by our clients and we just don’t have it outside of customer provided POS which doesn’t even include any co-op (ace, true value, etc…) due to their covenants with their members.
Hi Wally, Neither Robin or I know of a good source for hardware data. Two vendors to check would be NPD and Traqline. They do some work outside of traditional CPG channels but I don’t know exactly which categories they cover. Good luck! Please let us know if you discover any data sources.
Thank you for the article. I was wondering if you could let me know how to calculate a coverage factor
That will be addressed in detail in a future post, but in the meantime here are the steps:
1. Get correct data for shipments (internal, usually from Finance or Sales) and consumption (external, from IRI or Nielsen). Product, geography and period definitions should be as close as possible between the 2 data sources
2. Same unit of measure definition (both in cases or LBS, for example). Convert if necessary.
3. Need AT LEAST one full year of data, more = better
4. Arrange data so periods are in column A, shipments in column B, consumption in column C
5. In columns D and E, calculate rolling 12-month shipments and consumption. (Rolling means add the 12 months of data, ending with the row you are in. So…in the row for April, 2015, the rolling 12-month aggregate is May, 2014 through April, 2015. There should be no rolling aggregate in rows prior to the 12th period (if you have 12 periods in a year) or the 13th period (if you have 13 4-week periods in a year).
6. In column F, coverage = rolling consumption / rolling shipments (=D/E)
7. Coverage factor to use is the average of these rolling monthly coverage factors.
Hi Robin – Thanks for the content, this is very helpful. One question…did you ever have a dedicated post on coverage factors? I did a search but can’t seem to find it.
Finally wrote that post! Here it is.
How can I see how many units or a SKU or product has sold 2017 v.s 2018
Unit Sales (could be called Units or Unit Volume) is always a measure available in any report or database from IRI, Nielsen or SPINS. If you are asking about how many different SKUS (or items) have sold, the measure is Average Items. Read about that here: You could pull it for 2017 and 2018 to calculate the difference.
I work for a small CPG company and we don’t have syndicated data, how can we best estimate baselines and incremental sales?
Do you have any POS data from your retail customers? If so, then you may be able to do some modeling to get at base vs. incremental sales. If you only have shipments to work with, then that makes it a lot harder. As you can see from this article, the timing of manufacturer shipments and consumer takeaway (POS) is not the same. If you are asking about this for demand planning/forecasting purposes I think there’s a different solution than if you’re wanting to know for trade planning purposes and figuring out the ROI on trade spending. I’d be happy to discuss further and will email you offline.