 Do you debate which Circana/Nielsen measures to include in your trade promotion analysis? To make the right choice, you need a clear understanding of both your business questions AND the measures themselves. In my last post, I discussed the important distinction between presence measures and impact measures. Now I’ll illustrate how these measures tie together via Subsidized Sales.
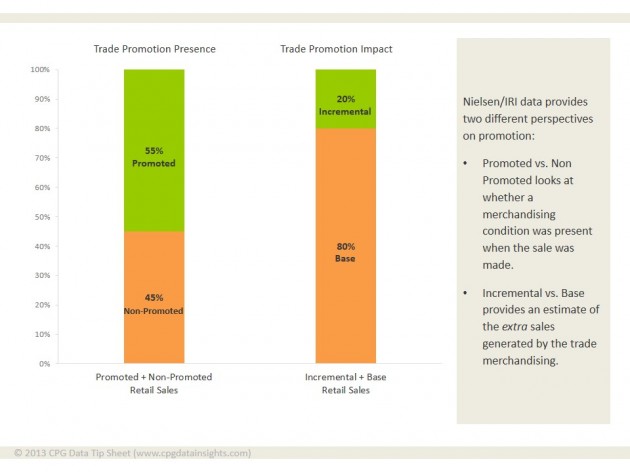
Before getting to Subsidized Sales, let’s quickly review our terms. When looking at trade promotion, there are two different ways of breaking up total sales. The presence view uses promoted and non-promoted volume and reflects whether merchandising conditions were present at time of sale. The impact view uses base volume and incremental volume to illustrate the extra sales generated by trade merchandising.
The following chart shows total sales using these two views:
Now we can bring in Subsidized Sales to integrate these two views. What are subsidized sales? Promoted sales that would have occurred anyway, even if no promotion had been present. For example, the shopper who buys your product every week and this week paid $.50 less because of a shelf price reduction contributes to subsidized sales.
All promotions will include at least some subsidized volume. After all, your sales don’t fall to zero when your product is not on promotion! Some buyers are loyal (out of preference or habit) and will buy regardless of feature, price reduction or display.
You may have a subsidized sales measure in your Nielsen/IRI database. If you don’t, it’s easy to calculate:
Subsidized Sales = Promoted Sales – Incremental Sales
% Subsidized Sales = (Promoted Sales – Incremental Sales) / Total Sales
Subsidized Sales can be expressed in dollars, units or equivalized volume – whatever is most appropriate for your business and audience.
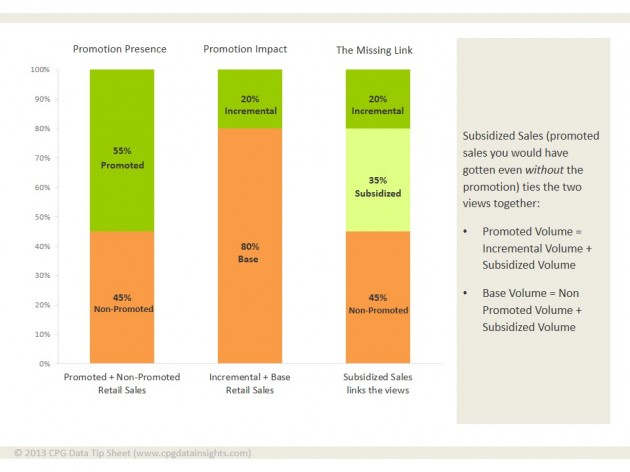
Adding Subsidized Sales to our original chart:
By quantifying subsidized sales, we can see that promoted volume is made up of subsidized volume (promoted sales you would have made anyway) and incremental volume (extra sales because of the promotion):
Promoted Sales= Subsidized Sales + Incremental Sales
We can also see that base volume is a combination of non-promoted volume (sales that occurred with no promotions present) plus subsidized volume (portion of your promoted sales you would have made even without promotion).
Base Volume = Non-Promoted Volume + Subsidized Volume
Does quantifying Subsidized Sales make the Nielsen/IRI promotion measures more intuitive for you? Will it help you explain the difference between non-promoted volume and base volume to people you work with? Let me know by leaving a comment below.
This post has been edited to reflect the corrections and comments of readers (see more of our discussion in the comments section).
If you enjoyed this article, subscribe to future posts via email. We won’t share your email address with anyone.


Nice article. Just to clarify one point, having worked for Both Nielsen and now for IRI, we both have measures which calculate subsidized volume by promotion vehicle. Thanks
John, Thank you for the updated information. I’ve edited my post to reflect the fact that Subsidized Sales is available as a database measure. I also checked a client database and found that they did indeed have a % of Total Dollars Subsidized fact. Their particular database doesn’t include this measure by promotion condition. But I’m glad to know that is available as well. It’s funny because I had checked their database previously, when I was writing the post, and couldn’t find the measure! I can get lost in the maze of facts as easily as the next analyst. My tip of the day: search your fact list for “sub”.
Sorry, late to the party!
Correct me if I’m wrong, but wouldn’t the IRi measure…… “Base $ Sales – Any Merch” essentially be subsidized sales?
Love this site BTW! A true life saver!
Yes, that is the amount of subsidized [dollar] sales but it is usually more useful to then convert that to a percentage so that you can compare the degree of subsidized across periods, products, geographies.
Another great post, Sally. I haven’t worked with the IRI/Nielsen measures in some time. That said, I like the use of Promoted Sales in the calculation of Subsidized Sales, but I was never a fan of Promoted Sales as a measure of promotion presence because it is inflated by the effect of the promotion itself (i.e., promoted stores will have higher than normal sales). Base Volume Promoted is the better measure because (unlike Promoted Sales) it negates the impact of the promotion, but (unlike the %ACV measures) it reflects the brand’s development in the store and not the size of the store.
John, Good point about the way in which different measures of promotion presence can be skewed one way or the other. I haven’t used % Base Volume Promoted in the way you described but I’m going to take a look at it next time I conduct an analysis and see how it impacts my conclusions.
I realize this post is a few months old, but I think you have a small error in your formulas. Shouldn’t the formula for % Subsidized Sales be…
% Subsidized Sales = (Promoted Sales – Incremental Sales) / Total Sales
… to match your second chart.
In other words, if you have $100 in Total Sales, $55 Promoted, $20 Incremental, $55-$20=$35 Subsidized, then % Subsidized would be (35/100) = 35%.
Actually, I just realized both formulas are useful. Your’s calculates the % of Promoted Sales that are Subsidized, mine calculates % of Total Sales that are Subsidized. The resulting percentages are different, but they represent the same thing in slightly different contexts. I would just clarify this distinction as not to confuse future readers. Thanks for all the great content.
Nestor, Thank you for your close reading and thoughtful comment. I’ve edited my post to adjust the formula. I agree that while what I had was not technically wrong, it was wrong in the context of the measures in the graph. Thanks so much for your input!
Nestor –
It’s good to know that our readers are really engaged in the content! As you and Sally mention, the correct calculation for what is shown in the graph above is (promoted – incremental)/total. In a database, that would be called something like “% Total Sales Subsidized.”
In the context of evaluating individual trade promotions, I think it’s more useful to look at what % of sales that are actually promoted are subsidized:
% sales subsidized = (incremental – promoted)/promoted
In the above example 35% of total sales are subsidized but 64% of promoted sales are subsidized. It is helpful to know that almost two-thirds of the promoted sales would have sold anyway, even without a promotion. (Note that during one promotion week at one chain, the % subsidized will be similar regardless of which denominator you use and they would be identical if 100% of sales are promoted.)
Thanks for the quick response Sally & Robin!
I’m a Software Architect with 15+ years of experience who just recently started working with CPG data. Your site has been crucial in my understanding of the subject. Although the math is pretty straight forward, the sheer number of concepts and terminology has been a challenge to wrap my head around. Thank you for volunteering your time and knowledge to help new comers (like myself) understand this dark art 🙂
I may ask a follow up question about negative subsidized sales (which I see another fellow reader has already asked), but I just want to make sure I understand his question (and your follow-up ) and see if it applies directly to my scenario.
Bests regards
Sally and Robin,
Do you know of a preferred number that manufacturers would like to strive for? In either of the scenarios mentioned?
For example if you used incremental/promoted and you got 45.6%, would 50 or better be optimal?
When using Nestor’s formula I get ranges from 15%-35% of total volume that is subsidized. Is this a better way to look at it or just different?
Thanks in advance!
Hi Cathy,
I don’t think you could have a “best practices” number for this measure that cut across manufacturers or retailers. Each manufacturer would have to identify their own targets in the context of their particular expectations and goals for trade promotion, what was realistic given their budget and tactics, and what was typical in their category. For example, if you have display activity, your % subsidized will inevitably be lower. If you’re in a category with a lot of display activity, and you pay for displays, your target for % subsidized would be a lot different than a manufacturer in a category where no one gets displays or for a manufacturer who doesn’t have a budget for displays.
Reading through all the comments on this post (of which there are many!), I note that Robin Simon commented that she thought looking at subsidized as % of promoted volume (rather than total volume) was more helpful in her experience. Robin has a wealth of experience so, if I had to pick one calculation, I would go with her recommendation. However, I do think doing it both ways and seeing what conclusions you draw could be valuable. Obviously a company without much trade promotion won’t have much subsidized volume either and illustrating that by looking at subsidized volume as a % of total volume could be a good remind of that or good context to have, even if subsidized volume as a % of promoted volume is high.
Hello
Sally and Robin – Thank you for all the posts.
My dataset from Nielsen includes % ACV Promo – How is this useful?
If you are interested in understanding the *quantity* of promotion (rather than the quality of promotion or the impact of promotion), % ACV Promo would be a potentially better measure than the more commonly used % Volume Promo. % ACV Promo is driven only by the number/size of the stores promoting your product and is not at all impacted by promotional lift (aka promotional response).
Hi Sally,
I am looking at an accoun’s level data for 13 weeks:
What does it mean if incremental $ is lower than subsidized $? Does this mean the promotion (either TPR, Display, or feature) was not effective?
What about if incremental units is higher than subsidized units? Would it mean the promotion was effective?
Finally, what does it mean if % lift (in display and TPR) is over 100%?
Thanks!
Mario,
1) “Effective” is in the eye of the beholder. It would depend on historically what do you expect to see for this product. It would depend on what type of promotion was running and what you paid for it. Each product needs to develop it’s own norms and benchmarks for what defines an effective promotion.
2) Well, lift is defined as incremental/base. So taking your question literally, a % lift over 100% means you more than doubled your base volume. Whether that is cause for celebration depends on what you were expecting and what type of promotion you were running.
Hi – using this in some of my analysis and curious to know which drivers would you consider when looking at subsidized sales trend? Since it is a base promoted sales measure, would you consider all promotional drivers (promo vehicle, frequency, …) to explain negative subsidized trends ?
I would definitely look at all promo drivers. In some cases, it might be predicted that a higher share of promotional sales are subsidized. If, for example, you did a lot of displays last year and this year you are focusing on shelf price discounts, a higher share of subsidized sales is highly likely. Of course, you probably paid a ton for the displays as well and, if you didn’t think they paid out, it might make perfect sense to cut them and take the incremental volume loss. Same things for your level of price discounts – higher cuts will likely bring more incremental sales (and lower share of subsidized sales) but at a what cost. So subsidized sales changes are not necessarily good or bad – it’s all context.
I think changes would most likely be driven by promotion changes and I would look there first. But I suppose it’s possible that other factors might come into play. If, for other reasons, you were losing lighter buyers who were less committed to the brand (say because of some new competitor that was stealing all but your most loyal users), then all trade promotion might less effective at driving incremental volume.
Hi
I’ve just been introduced to “subsidized volume” and I am trying to wrap my head around the best way to explain the term and the math to non-analyst members of my team and how best to convey that information to our clients (manufacturers). The concept seems somewhat esoteric and I want to be able to tie it to discussions around trade spend with our clients.
Also, want to say that this site is a huge help. Thank you for taking the time to put all of this in one place and make it understandable/digestible.
Thanks for the kind words – glad you are finding the blog useful!
This post explains the concept of subsidized very well but if your clients are still having trouble, I’d be happy to set up a 30-minute call to discuss further. I’ll contact you via email to set something up.
Hi Sally & Robin,
I have been struggling to understand the concept of Subsidised Base so your website is an incredible help! Thanks very much!
I want to understand more on how it could be useful in assessing the effectiveness of the promotion. What does it mean when we see positive growth in Subsidised Base compared to YA? What does it mean when Subsidised Base is greater than Incremental Sales? (Is that a bad thing? Is it indicating that the supplier is merely susidising their base rather than driving incremental sales?)
Thank you in advance!
We’re glad you’re finding the CPG Data Tip Sheet useful! If the objective of the promotion is to gain new buyers or get current buyers to purchase more, then you do want to see incremental higher than subsidized base. If you’re seeing growth in subsidized base vs. year ago it means that more of the sales were to people who would have bought the product anyway (without a promotion), so usually not a good thing. Keep in mind that there will always be some subsidized base and sometimes a promotion is meant to reward current users, as well as attract new ones. Hope this helps!
Dears,
has anyone had to provide guidelines to KAMs to input uplift when loading promotions based on the knowledge of promo volume?
Regards
Fabrizio
Dear Fabrizio, Sorry I am not familiar with the term KAMs. If you add more explanation and detail to your question, I will try to help. Sally
Oh Sorry. I mean Key Account Manager in Sales. Fabri
If I understand your question, you are asking about how to provide guidance to sales regarding what retail lifts they might expect for trade promotions. To do this, I analyzed past promotions for each product and looked at average lifts. However, sometimes the new promotions will be for discounts or offers that haven’t occured in the past. For that, I would make an estimate based on what competitors have done. If no one in the category has ever done the promotion and it’s much different than any past offer, then all you can do is make a best guess on how it will perform and retail and know (and communicate to everyone) that there is a big error bar around that lift.
If estimating future promotion lifts is an important function for your organization, it’s helpful to create and maintain a database that keeps track of promotion lifts and the factors that might have influenced them (timing, offer, etc). If you keep up with this, then the information will be at hand when you need it and you won’t have to quickly do a big analysis to pull promotion lifts on the fly to answer an urgent question. Hopefully this is helpful and that I understood your question.