

According to the dictionary, the price of something is “the sum or amount of money or its equivalent for which anything is bought, sold, or offered for sale.” Pricing is one of the “4 Ps” of marketing that we learned about in school (along with Product, Placement/Distribution and Promotion) and is often a key driver of how consumers perceive the quality of a brand or product. But…which measure would you use when answering the question: “What’s your retail price?” (Just to clarify, the retail price is what consumers pay for a product when they buy it at a store, not what retailers pay to buy the product from a manufacturer. The retail price is what IRI and Nielsen report.)
Your IRI/Nielsen database can have as many as 226 different facts relating to price! The number of facts increases quickly when you consider all the different merchandising conditions (talked about here) and the various change measures (absolute, %, vs. year ago, vs. previous period, etc.). If you are just getting started with this kind of data, the first thing to look at is average price, the most basic price measure. Average price is the best way to compare your overall pricing to the competition and to identify which brands are premium, mainstream or value positioned.
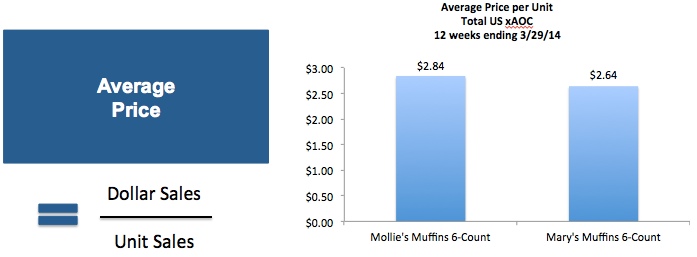
Reminder: If you are looking at price per unit, make sure the items in your product totals are all similarly priced. Notice that in this example we are looking at 6-count muffins. Do not look at price per unit at the brand level unless all the items in that brand are the same size (or close enough to be priced together.
While average price is a general indication of pricing, NOBODY actually pays that! Shoppers either see the “everyday price” if the product is not on sale that week or the “sale price” if it is on sale. Take a look at the national data for two different Muffin brands below. Mollie’s has the higher average price ($2.84 v. $2.64), but looking at the different components of those average prices shows a more complete picture. Mary’s has a higher everyday price and even crosses the $3 threshold ($3.26 vs. $2.95), but it has a lower sale price than Mollie’s ($2.31 vs. $2.58).
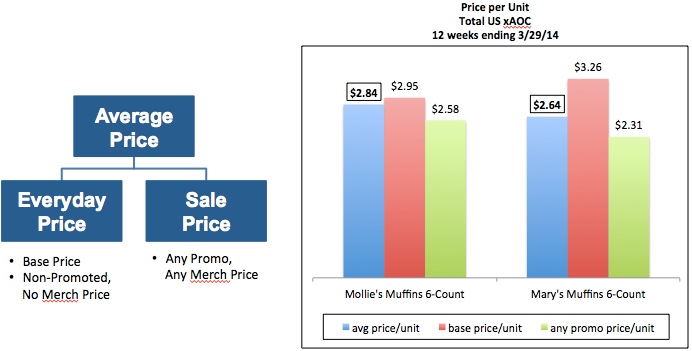
Note: Base price and Non-Promo (called No Merch in IRI) price are the measures used for “everyday” (not on sale) price. The most basic measure of “sale” price is Promoted price (called Any Promo in Nielsen, Any Merch in IRI). A future post will explain why it is important to further decompose Promoted price based on merchandising tactic.
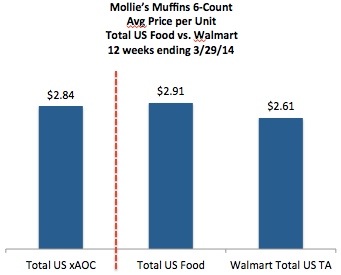
A second way to understand what is really happening with pricing is to look below the national, all outlet level. Just as nobody pays the average price for anything, nobody pays the national price either. The national price is made up of dozens of different retailers in different markets around the country, charging different retail prices for the same product. The above example shows data for Total US xAOC, the largest geography available in Nielsen (read more about that here). Although this gives a general picture of pricing, it is very common (and recommended) to at least break down national pricing into Total US Food/Grocery vs. Walmart. Those two channels tend to have very different pricing strategies, with prices at Walmart significantly lower than those in the Food channel, like for Mollie’s Muffins 6-Count:
Of course, if you’re presenting to a specific retail customer you would look at pricing for that retailer. Even within the Food/Grocery channel there is typically a wide variation in pricing between retailers. It is also useful to look at pricing across retailers when evaluating your pricing strategy and assessing in-market retail execution.
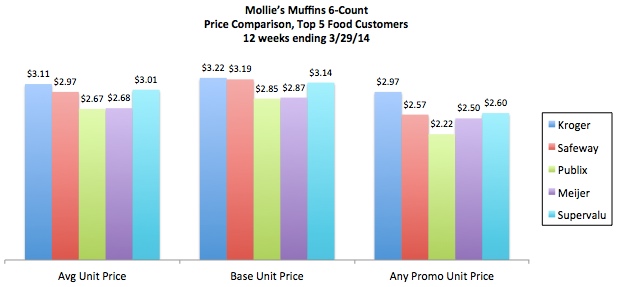
Looking at the top 5 Food customers for Mollie’s Muffins, you can see that:
- There’s a wide variation in average price, with two of the top five retailers significantly below $3, another two right around $3 and one above $3.
- The everyday, or base, prices are much closer at the top five retailers, ranging between $2.85 and $3.22.
- The sale, or promoted prices, show the widest variation between retailers.
If you look at base price per unit at a particular retailer in a specific market, that is probably as close you’ll get to seeing the regular price that shoppers actually pay in-store. (Promoted price, even for a specific retailer, is still a weighted average of the different merchandising tactics so not likely to be a real price that shoppers see.)
So…what have we learned from this?
- Average price is a good place to start when trying to understand retail pricing.
- When looking at price per unit, make sure it’s for a promoted product group – an aggregation of items that are priced together (and usually the same size).
- It is useful to understand the components of Average Price and not just rely on that one measure.
- Different channels and different retailers within channels have different pricing strategies. This should be considered when developing your pricing strategy and evaluating its execution and effectiveness in the marketplace.
Did you find this article useful? Subscribe to CPG Data Tip Sheet to get future posts delivered to your email in-box. We publish articles twice a month. We will not share your email address with anyone.
If a consumer buys something with a coupon, how does Nielsen record the price paid? Is it price less coupon? Or does the coupon discount not get reflected?
Manufacturer coupons are not reflected in syndicated data prices. Retailer coupons should be reflected.
Are retailer coupons reflected in base, promo, and avg prices?
Retailer coupons would be reflected in promoted price and also average price but not in base price. Remember that base price is the price if no retailer promotions were present.
When calculating any promo price/unit, is the formula (any promo dollars/any promo units)? Does the formula (promo dollars/total units) make any sense?
The formula for Any Promo Price/Unit is Any Promo Dollars/Any Promo Units, your first point. I have never seen the 2nd formula you reference. Can you give me more information about when you might use that?