We’re delighted to have guest contributors Mark Laceky (President) and Mike Fridholm (SVP, Client Service) from mLogic Consulting introducing one of their favorite measures. Keep in mind that this article is most relevant for use in more strategic planning and analysis, not necessarily for new users or with retailers. Their contact details can be found at the end of this article.
In the beginning of the scanning data age, distribution and promotion support were calculated very simply. The number of stores carrying your product divided by the total number of stores in the marketplace gave you Percent of Stores Selling (PSS) as the key distribution measure. Similarly, promotional support levels were calculated simply as the number of stores promoting divided by the number of stores in the marketplace, giving you Percent of Stores Promoting (PSP).
This was good enough for a while but it had a major drawback – it assumed all stores were of equal importance. Put another way, it assumed that being carried or promoted in a small store was just as valuable as being carried or promoted in a bigger store. As readers of the CPG Data Tip Sheet know, %ACV is a better measure than PSS because you get more credit for being in bigger stores that have more traffic.
The most commonly used measure of the amount of merchandising support is “Cume Weighted Weeks” (“CWW” in Nielsen, “Wtd Wks” in IRI). Click here for more information on CWW. It is a fine measure of reach and frequency of merchandising support for UPCs and has served the industry well for 25+ years. And it uses total store sales (ACV$) to better weight how important stores are. But…

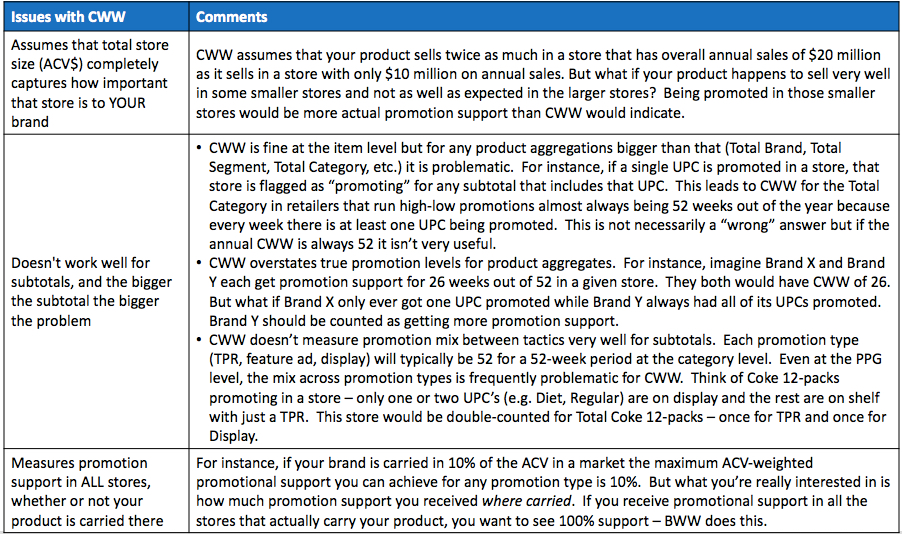
There are limitations when using CWW!
The chart below summarizes what these issues are:

A Better Way – Base Weighted Weeks (BWW)
We’d like to familiarize you with a calculated database fact known as Base Weighted Weeks (BWW). Check with your data supplier to see if you have access to BWW on your database and, if so, where to find it. Similar to CWW, BWW weights the importance of each store promoting, but in a better way – BWW uses each promoted UPC’s own base volume in each store to weight each store’s importance to your promotion analysis.

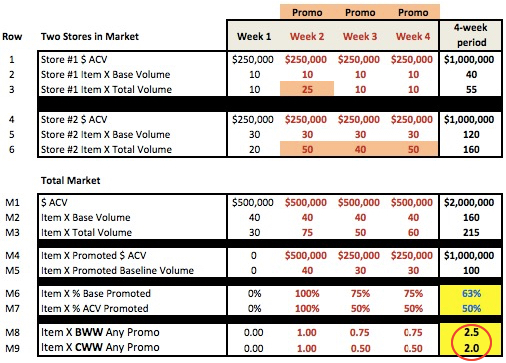
Let’s take a look at a very simple example of one SKU (“Item X”) in a market that has only 2 stores over a 4-week period. (Note that this applies to all different product and geography levels that you might be looking at, from a SKU to a category and from an individual retailer within a market all the way up to a national channel.) You can see that while both stores have the same amount of Total ACV $ every week, Store #2 is much more important to Item X than Store #1 given its higher weekly base volume of 30 EQ (vs. 10 EQ):

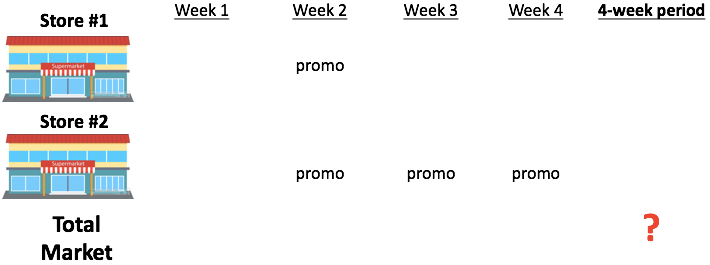
Now let’s say that over a certain 4-week period Store 1 promoted during week 2 and Store 2 promoted during weeks 2, 3 and 4 and we want to know how much support did Item X get in the Total Market for the 4-week period:

The table below contains the data needed to calculate BWW. To cut to the chase…BWW is 2.5 while CWW is only 2.0 over the entire 4-week period we are looking at. BWW is higher because the store that accounts for more of Item X’s base volume is the one that promoted for 3 weeks instead of only one.
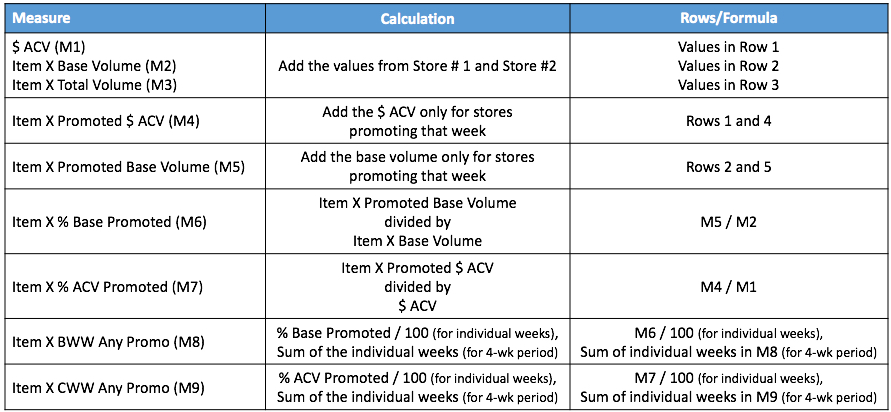
 And here are the calculations:

Thus, the Base Weighted Weeks tell us that Item X received promotional support in stores representing 63% of its base volume versus only 50% of the total ACV, and 2.5 Base Weighted Weeks instead of the 2.0 ACV-based Cume Weighted Weeks out of 4 total weeks. BWW shows us that we received more real support than CWW suggests. (Note that both BWW and CWW are usually shown with one decimal place.)
So What?
OK – so it’s a little more accurate and you can use it with subtotals – is that all? Why would I want to go to the trouble of getting to BWW? The ultimate benefit of BWW is that it can be used as part of a predictive system. BWW can be used as a component in a simple Excel-based simulation tool because all the math works out to the last decimal point. This is not true with CWW. In Part 2 of this article we will discuss how to use BWW to calculate the impact of changes to your trade promotion plan. We’ll also discuss why we avoid the “F” word (“forecast”). So – stay tuned for BWW Part 2: Simulating Pricing and Promotion Impacts.
Please direct comments and questions about this article directly to Mike. His contact details are below.
Mark Laceky is President and founder of mLogic Consulting, Inc. which specializes in consumer packaged goods (CPG) pricing and trade promotion strategy. He previously managed the Nielsen North America Price & Promotion analytics practice and spent years in analytical leadership roles at Kraft Foods and The Quaker Oats Company. He may be reached via LinkedIn.
Mike Fridholm is SVP, Client Service at mLogic Consulting, Inc. His prior experience includes leadership of the Kantar TNS North America Consumer Goods vertical as well as positions managing a Nielsen office, large IRI client relationships, and category management and brand management roles at The Quaker Oats Company. He can be reached at mfridholm@mlogicconsulting.com or on LinkedIn.

Hi!
I apologize for the number of questions I ask on this site! Although I believe Nielsen only offers the measure, I was wondering if this would be a better measure to use than CWW on the Volume Decomposition reports since it is a more accurate measure of the amount of trade support received?
Thank you,
Ryan
Yes, you could definitely use BWW instead of CWW in a Volume Decomp analysis! I did it with CWW since most people are familiar with that and I’m pretty sure it’s easy to find on most databases. BWW is a more complex concept for people to grasp and those facts are sometimes buried deep in levels of folders on a database so I went with CWW. If you’re comfortable with BWW and have access to it, go ahead and use that in the Volume Decomp. The “elasticity” would be Incremental LBS per BWW.