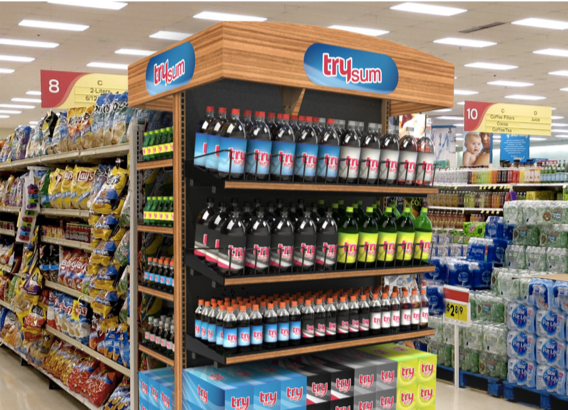

Does Nielsen data say your brand is getting less Display support than you think you are (or that you’re paying for)? This post gives many reasons why that commonly happens.
Here is part of an actual email that we received from a reader. See if this sounds familiar: “I am the owner of a regional snack distribution company. Recently we executed a display for a client. I know that the display was present in 89.7% of the nearly 200 stores for the grocery chain. The supplier, concerned that his items are not moving well, told the buyer that the % ACV Display was only 25% according to Nielsen, and implied we did not execute his program. Not only do I have hard actual data to dispute this, I also had my team verify the displays. Please help me understand why the Nielsen data is so far off?”
IMPORTANT NOTE: This post relates to Nielsen Display data only. IRI has some different rules. See the Comments on this posts for some information on that. Please contact your Nielsen or IRI client service team with further questions. (And feel free to comment here with any new/different information that you receive on this topic so that others can benefit from that knowledge.)
Collection of Display
Among the various retail data available from Nielsen with a standard contract, Display data is the least “exact.” Dollar, unit and EQ sales and pricing data come right from the retailers’ POS systems and are closest to what the retailers see in their own systems. Feature data is also very good, although not quite as good as the sales and pricing data. since humans actually go through and code which specific items are included in each retailer’s ad vehicles. (There are specific rules for Features but that is a topic for another post.) For Display, the syndicated data suppliers do not go into every single store but, rather, send human auditors into a sample of stores. So…it is possible (but not likely) that the your displays were not in any of the sample stores that are tracked by Nielsen. The specific stores included in the sample are not made public, so that manufacturers cannot manipulate results (like making sure that Displays are always up in those stores!). The same auditor goes into the same stores each week so is very familiar with their stores and where to look for Displays. They also go through the entire store and record Display information for all categories in the store. This allows for consistent trending over time and comparison vs. year ago. The auditors go into the stores on the day that new sales prices go into effect for that chain. This maximizes the likelihood that Displays will all have product on them and not be empty, which can happen toward the end of a sale.
Definition of Display
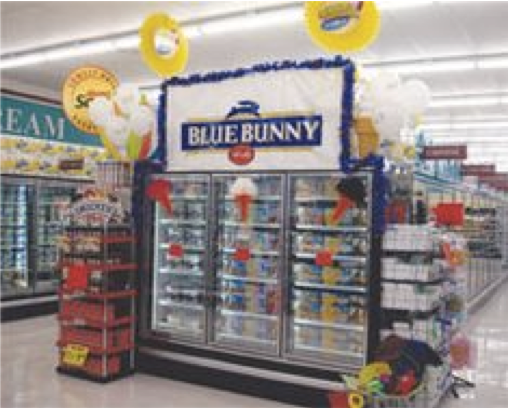
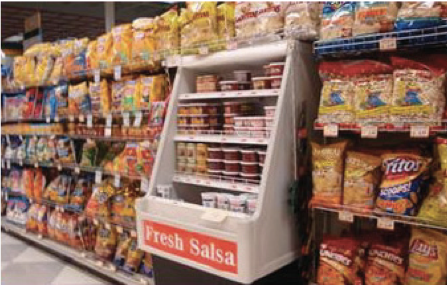
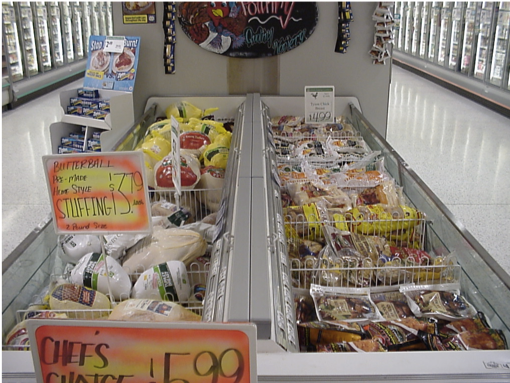
The most common confusion is around what Nielsen counts as a Display. Because all the auditors need to be consistent in what they count as a Display, there are very specific rules as to what is included and excluded, rooted in how shoppers are likely to think about displays. This does not always correspond to how a manufacturer thinks about them. A Display needs to be something special and only available for a limited time, from a shopper’s standpoint. Displays provide in-the-moment motivation to purchase. Note that although it is much more common for shelf stable products to be on display, most retailers also display frozen products (in end-aisle freezers or coffin cases). Refrigerated products get the least amount of Display. Here are the rules for a Display:
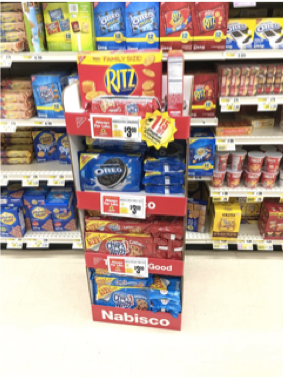
- Must be an additional but not regular shelf location. This is why Displays attract shoppers’ attention – they are not expecting to see those products on an end-aisle display (also known as an endcap) or in a shipper in the middle of the aisle. Common misunderstanding: If product is in a shipper but that is the only location in the store, that is NOT a Display. (Think about seasonal categories like sunscreen or certain candy brands that may only be in the store for a few weeks or months.) And another thing about shippers…not all product that arrives at a store in/on a shipper is sold off of that shipper! It is not unusual for a retailer to order display shippers but then take the product out and put it on the regular shelf. So…there may not be a Display for auditors to see. And the retailer’s POS system can’t tell the difference between an item that was sold from the regular shelf or off a shipper or end cap! You really do need the human intervention of auditors to identify in-store Displays (unless there is a different UPC on the package when it is on a shipper, which rarely happens).
- Must be a temporary location. If the product is always there then the shoppers soon realize it’s not anything special so the impact of being on Display diminishes. The data suppliers have different thresholds after which a Display is no longer considered temporary.
- Must have product on it. There must be product on the end cap or in the shipper for it to count. Sometimes a shipper is empty (even though it’s obvious what is supposed to be in it) or a shelf on an end cap has a shelf tag for a product that is out-of-stock.
Display Measure, Part 1
The most common measures of the amount of Display (as opposed to the impact) are %ACV and CWW (cume weighted weeks). The reader question at the beginning of this post says that he knew “that the display was present in 89.7% of the nearly 200 stores” even though Nielsen said % ACV Display was only 25%. First of all, % of stores is not the same as %ACV. You read more about %ACV here, but basically it weights bigger stores more heavily since not all stores are the same size and have the same number of shoppers. But the difference between 89.7% and 25% is way too big for the discrepancy to be due to difference between % of stores and %ACV.
Display Measure, Part 2
Another thing that could have caused the difference in amount of Display described by our reader is the specific merchandising condition he was looking at in Nielsen. He should look at “Any Display” which includes all stores with a Display, whether or not there was also a Feature and whether or not there was a price discount. It is possible that he was looking at “Display only.” That would only include stores that had Display but no Feature that week and there may or may not be a price discount. It is possible for products to be on Display at the full price. Retailers will sometimes put items on Display for a week or two at the regular price after they are on sale in order to get rid of excess inventory.
And the answer is…
So for those who are wondering why Nielsen data only showed 25% ACV Display instead of the 89.7% that our reader says they actually had…here’s why the numbers are so different (in likely order of importance):
- Retailer took product out of the shippers in most/many of the stores and sold it off the regular shelf. Remember – based on the rules that product must be on/in the physical display for it to count for IRI/Nielsen purposes.
- Nielsen measure looked at was Display only, so did not include the group of stores for which there was also a Feature also happening during the week.
- Even though the reader had his team “verify the displays,” it is possible that the definition they used was not the same as that of the consistent, objective third party. I’m not sure how this was verified (photos that were date/time stamped with exact location?), but there would be some incentive for the people responsible for making sure the displays are up to say “yes, the displays are up in all my stores.” Just sayin’…
One Last Thought
Even though the Display data in Nielsen may be different than how you like to measure Display, they are still the best way to track Display activity on an on-going basis and are comparable across categories, brands and geographies. OK, I’m ready for readers to possibly dispute this but as of now (December, 2019)…I am not aware of any AI, machine learning, robots, etc. that can track all Displays in all categories in all stores on a weekly or more frequent basis. If you need to understand shelf conditions or Display compliance for a point in time, there are firms like Field Agent, Gigwalk and others that can do audits of specific brands and stores on an ad hoc basis. Be prepared to give them a store list and be very specific about what you want to know. Please comment below if you’ve had any experience doing an ad hoc, on-demand audit – would love to hear about it and how helpful the results were for the business.
Did you find this article useful? Subscribe to CPG Data Tip Sheet to get future posts delivered to your email in-box no more than once a month. We won’t share your email address with anyone.

Love your CPG Data Tipsheet. You shared a great rationale for the nuances around display measurement. However, %ACV Display Only could include a price discount. You noted twice that this measure does not include a price discount.
%ACV Display Only differs from %ACV Any Display in excluding ACV that had both a display AND feature that week.
Thanks for your comment! I have modified the post to correct the definition of the “Display only” merchandising condition.
Your information on display capture in your latest post is not accurate – I work for IRI and the rules for capture that you list are not correct. It was important to me to email you as we get a lot of questions on this and it makes our jobs difficult if there is misinformation out there. In IRI, displays do not need to be temporary – there is no threshold. A display unit will always be marked as display, even if it’s there every day of the year. And it’s a display even if it’s the primary location, in the example you gave of a product only coming in temporarily – that would still be marked as display. There are a few specific exceptions where we don’t categorize as display where a brand or whole category’s primary – and typically only – location is on display, but those are named exceptions like specialty bakery tables or battery centers – it does not apply universally. Also, Display Only can have price discount as well. It just means Display without Feature.
Thanks for your comment! I have modified the post to indicate that the information is for Nielsen Display data only. Of course we want the CPG Data Tip Sheet to always have correct information. We are supplier-agnostic and so try to provide information that is relevant for IRI and Nielsen. But in this case, it is clearer for readers for us to clarify that the post is about Nielsen only. Please use the Contact Us link if you would like to write a guest post!
Thank you for the post, I am a frequent visitor to the site and really appreciate all the great insights you provide here.
In the past I have used “% of Units Sold on (promo/display/etc)” as a way to measure promotional activity as opposed to %ACV promoted. Is one measure better than another for tracking promo support? Or are there situations for each?
Thanks for the kind words – glad you find the blog useful! Both facts that you mention are examples of measuring the presence (as opposed to the impact) of merchandising. See this post for more on that. % Units Sold on Promo tells you what portion of your sales came from stores with a promotion but %ACV promoted tells you essentially what portion of stores were promoting you (weighted by store size). It’s possible for you to have in a given week for example, 24% ACV promoting your brand but 50% of your sales units being promoted. The %ACV measure gives you a sense of how much of the retail trade was giving you support. % Units Sold on Promo can also be affected by the promoted price point and discount and by which other brands were promoted a the same time whereas %ACV Promoted is pretty much a standalone measure.