Featured Article
Thank You, Readers on Our 10th Anniversary!...
Featured Article
20 Golden Rules to Help You Shine As An Analyst
Featured Article
Visualization: A Picture Is Worth A Thousand Numbers...
Featured Article
Transforming your syndicated data into business insight

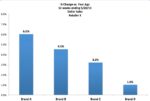
Assume there are 4 brands in your category at Retailer X, with dollar sales growth as shown in the graph below. Which brand would you say is performing the best? How about the worst? Since this is not a trick question, Brand A is performing best with dollar sales growing the fastest, at +6% vs. […]