 Sometimes you want to know total ACV for a retailer (in other words, not just how much they’re selling in your category, but how much they’re selling in the entire store). You need this number to assess trading area trends or to find out whether the retailer is getting their fair share of sales for your category. But what if you don’t have this measure? Not all databases include it and you won’t automatically get it in an ad hoc Excel report. Fortunately, you can estimate it yourself.
To do so, you need data for a product level that is always available with 100% distribution. Usually this criteria will apply to your category total – there is probably at least one item that sells in that category every day of every week. But if you don’t have a product level that is always available 100% of the time (or something very close to it) stop now because your calculation will understate ACV.
Assuming you have that product line with consistent distribution of 100%, grab:
- Dollars
- Dollars per $MM ACV (or “Dollars per Million”)
“Dollars per Million” holds the key to calculating ACV because ACV is the behind-the-scenes denominator. Therefore:
Retailer ACV = (Dollars / Dollars per million) * 1,000,000
Typically, you’d use a time period of 52 weeks because most of the time you’re using the ACV to quantify annual opportunities. But the calculation can work regardless of the time period selected.
If you purchased an Excel report with a shorter time period (say 13 weeks), use the calculation above but multiply ACV by four to get to an annual estimate.
What if you use the 52-week values from your database to do the calculation but your ACV estimate looks way too low? In some databases, 52-week values are aggregated from 1- week values or 4-week values. If this is true for you, you’ll need to multiple your results by either 52 or 13 to get an annualized number.
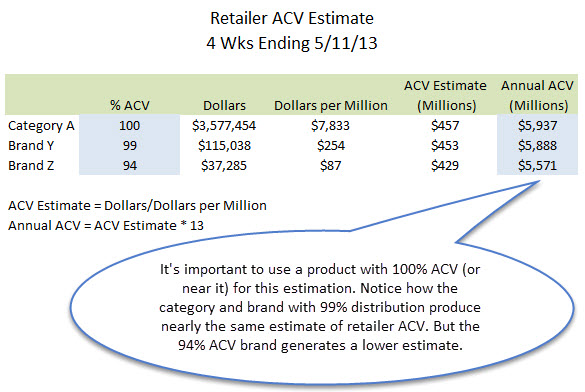
Here’s a real example using a recent 4-week period for a nearly $2 billion dollar retailer.

Did you find this article useful? Subscribe to CPG Data Tip Sheet to get future posts delivered to your email in-box. We publish articles twice a month. We will not share your email address with anyone.

Appreciate this info. Really helps to deepen the understanding of this metric and its usefulness. One small glitch, however. It looks like the Annual ACV in the above example table is calculated using the ACV Estimate * 4 vs. *13 as indicated in the footnote definition.
Thank you for your careful reading! I’ve fixed that error now in the original post. I appreciate you calling it to my attention.
Very useful info. In case there is no product with 100% ACV, can %ACV be used to make the Annual ACV more accurate by adjusting the formula for ACV estimate as follows: Dollars/(Dollars per Million * %ACV).
e.g. for brand Y:
ACV Estimate = 115038 / (254 * 0.99) = 457.48
If it’s close to 100%, this will be fine to do. But if it’s not close, if it’s for example 75%, then you are assuming the part of the distribution you are missing is just like the part you have. So I wouldn’t do it – you can get misleading results if that’s not a fair assumption. Another thing you can do is find estimates of total retailer sales in the trade press. I’ve found they usually line up pretty well with the numbers I get using this method.
I don’t have dollars per million on my IRI report. How can I calculate it?
Unfortunately, you can’t. If you don’t have market ACV and you don’t have $/mm, you won’t be able to do what I did in this post.