 If you are a CPG company with significant trade promotion spending, you probably already buy IRI/Nielsen data or are seriously considering it. Both IRI and Nielsen measure Incremental Volume: how much extra volume you sold due to trade merchandising.
If you’re not sure what incremental volume is, read this first. If you’ve already got the basics down, and want to know more about how the estimates are derived (and why you sometimes see some counter-intuitive values) read on.
Incremental Volume Depends on Base Volume
First thing to know: Incremental volume is calculated from Base Volume. When I first started working with this data, I thought incremental volume must be directly estimated, based on the amount of promotion I received in a particular week. But it doesn’t work that way.
Incremental Volume = Actual Volume – Base Volume
Base Volume Is an Average Based on the Past
So how do IRI/Nielsen estimate base volume? They each have proprietary elements to their methodology which they may share if you ask them for details. In simplified terms, though, the approach they both use is a rolling average of past non-promoted weeks. In other words, they take past data points for an individual UPC in an individual store, pull out all the weeks with trade merchandising, and smooth the remaining weeks to come up with an estimate of current expected sales without trade promotion.
This approach guarantees that base volume will be smoother than total volume. That’s partly because the baselining methodology ignores trade promotion weeks which typically have big spikes in sales. But even if nothing changed in the marketing environment, actual volume would have more random variation than base volume because base volume is an average.
What are some of the surprising things you may see because of this approach?
1) In many non-promoted weeks, you will still see some incremental volume. IRI/Nielsen provide an incremental volume value for every week. In non-promoted weeks, incremental volume should conceptually be 0, right? How could you have any incremental sales due to a promotion if there was no promotion? In reality, in non-promoted weeks, incremental volume is not 0. It is Actual Volume – Base Volume, which will be some positive or negative number and may be very close to zero but unlikely to actually be zero.
2) You can have positive incremental volume when there is no promotion. Actual volume will sometimes be randomly higher than base volume. Or actual volume will be reflecting some new positive trend that is not yet reflected in the historically derived base volume. Base volume will catch up over time but might be lower than actual in this particular week.
3) You can have negative incremental volume, sometimes even in a promotion week. This doesn’t mean your trade promotion hurt your sales! Negative incremental volume can be due to fluctuation; actual volume can be randomly lower than the smoothed base volume. Negative incremental volume can also be driven by things like competitor actions or price increases. Let’s say this week you have a shelf price reduction but your competitor has a price reduction and a display. Your sales go down when consumers flock to the competitor’s display. This results in actual volume lower than base volume for you and that means negative incremental volume.
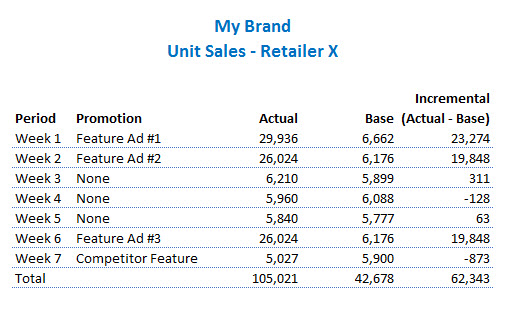
Here’s an example of weekly data for a product in one retailer. Notice the fluctuations in incremental unit sales in weeks with no promotion for my brand.

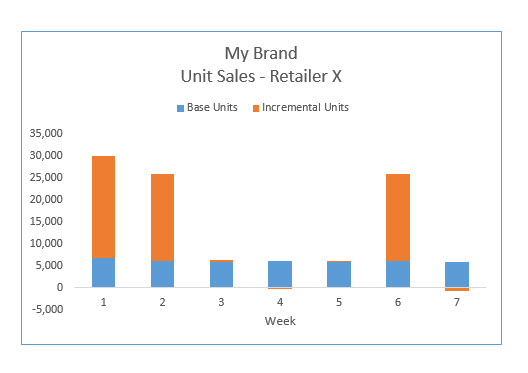
So incremental volume in non-promotion weeks and negative incremental volume are “normal” or, more precisely, expected given the IRI/Nielsen methodology. If the numbers are small, relative to total sales, you can safely ignore them. Beyond just staring at your data, how do you decide if the numbers are “small”? One way to get an overall assessment is to graph them and look at their size relative to the promotion weeks. Here’s an example of how that looks using the numbers from the table above:

Another approach would be to sum the incremental volume in non-promoted weeks. In the above example, this would be 311 – 128 + 63 – 873 = -627. This total is tiny (less than 2%) relative to both the size of the base business (42,678) and the incremental volume during this period (62,298).
Occasionally, though, incremental volume anomalies will be large enough to cause trouble. Symptoms of “trouble” include merchandising efficiency over 100% or negative incremental volume across long periods of time. In my next post, I’ll provide some suggestions for diagnosing and dealing with these problems.
Need help getting the most from your IRI/Nielsen investment? Contact us to discuss your project. We provide a range of services covering training, analysis, and report development.
If you enjoyed this article, subscribe to future posts via email. We won’t share your email address with anyone.

Thank you for a great post Sally!
I have some questions though concerning using this methodology in MMM.
if we assume that each media variable has a different response curve (for example – TV – S-Shaped, Radio – negative exponential etc. that are responsible for the diminishing returns) how can we combine all these transformations to get one linearized MMM model? Or maybe we should model the baseline first and then each of the incremental part (additional sales caused by radio, TV etc.) separately?
I’m not sure I fully understand your question so please feel free to ask another if I’m not getting at what you are asking.
The Nielsen/IRI approach to estimating incremental sales is completely specific to trade promotion analysis. The approach doesn’t apply to any other marketing variable. They don’t attempt to use it to estimate incremental sales from any other marketing variable. In fact, if they do a MMM project for a client, where they are working to estimate other types of marketing effects, they use different approaches/models.
Thank you! So, for example, in case of MMM baseline is a constant + trend + seasonality + macro factors + weather etc. – variables that are “independant” and the marketer can not influence them – am I right?
I agree that those examples of independent variables would be part of base volume and couldn’t be influenced by marketers.
What I want to make sure is clear, though, is that a lot of things that marketers *can* influence are part of the “base volume” metric that is provided by Nielsen/IRI in their syndicated databases. In those databases, “base volume” includes everything EXCEPT trade promotion. So it’s not really what you and I might think of as “base volume” in the more literal sense. Does that make sense? Nielsen/IRI “base volume” is a very specific thing – all it has stripped out is trade promotion.
Hi Sally,
I am a big fan of your insightful portal, indeed a vital source for Nielsen/IRI/Syndicated data knowledge. I wish you never get tired 🙂
Two question –
1. What is the methodology/formula Nilsen/IRI use to identify base sales?
2. I understood that ‘Incremental sales = Actual sales – Base sales’, Is not increment can happen due to some other factor/independent variables.
So how does impact of other variables get adjusted to ensure what we are quoting as incremental sales are actually driven from trade promotion only?
Thank you
Dear Madhu,
I’m glad you’ve found our posts helpful!
1) Unfortunately, I can’t tell you any more than what I wrote in this post. They have proprietary methodologies that use some type of rolling average of sales in stores without promotions.
2) Again, the base sales estimate is created by looking at an average of sales in weeks *WITHOUT* trade promotion. Since the impact of other variables is reflected in those weeks without trade promotion, then the impact of other variables will also be reflected in the base sales estimate. Of course, this won’t always work perfectly, since it’s a fairly simplistic approach and sometimes base sales estimates (for certain products and certain categories) won’t make perfect sense or may not fully capture the impact of other variables. I talked about some of those problems in the post and I wrote another post that has suggestions for what to do when your incremental and base sales estimates are wonky.
Thanks for the article! Sorry if this was discussed in another article, but what’s the difference between actual and base volume?
Base volume is the Nielsen/IRI estimate of what your volume would have been without trade promotion. They factor out three specific types of trade promotion: displays, retailer feature ads, and shelf price discounts. So the difference between actual and base volume is called “incremental volume due to trade promotion”.
I have developed model for base sales. Now If I wanted to do develop model on increment sales (Actual – Base) only. How I deal with negative volume.? If I replaced that with 0 I will lose info for that week, any guidance how I deal with those negative volume.
As it says in this post, negative incremental volume is not at all common. Sorry, but I don’t have any good advice for you on how to deal with negative incremental volume when trying to build a model. IRI and Nielsen have teams of PhD statisticians who work on their models for base volume and then incremental is just the difference between total and base volume.
We don’t have IRI data, so I’m working blind, but my controller is looking at shipments and wants to tie that back to base volume. How can we use shipment data to forecast base volume?
Do you have any POS data from your retail customers? If so, then you may be able to do some modeling to get at base vs. incremental sales. If you only have shipments to work with, then that makes it a lot harder. As you can see from this article, the timing of manufacturer shipments and consumer takeaway (POS) is not the same. If you are asking about this for demand planning/forecasting purposes I think there’s a different solution than if you’re wanting to know for trade planning purposes and figuring out the ROI on trade spending. I’d be happy to discuss further and will email you offline.